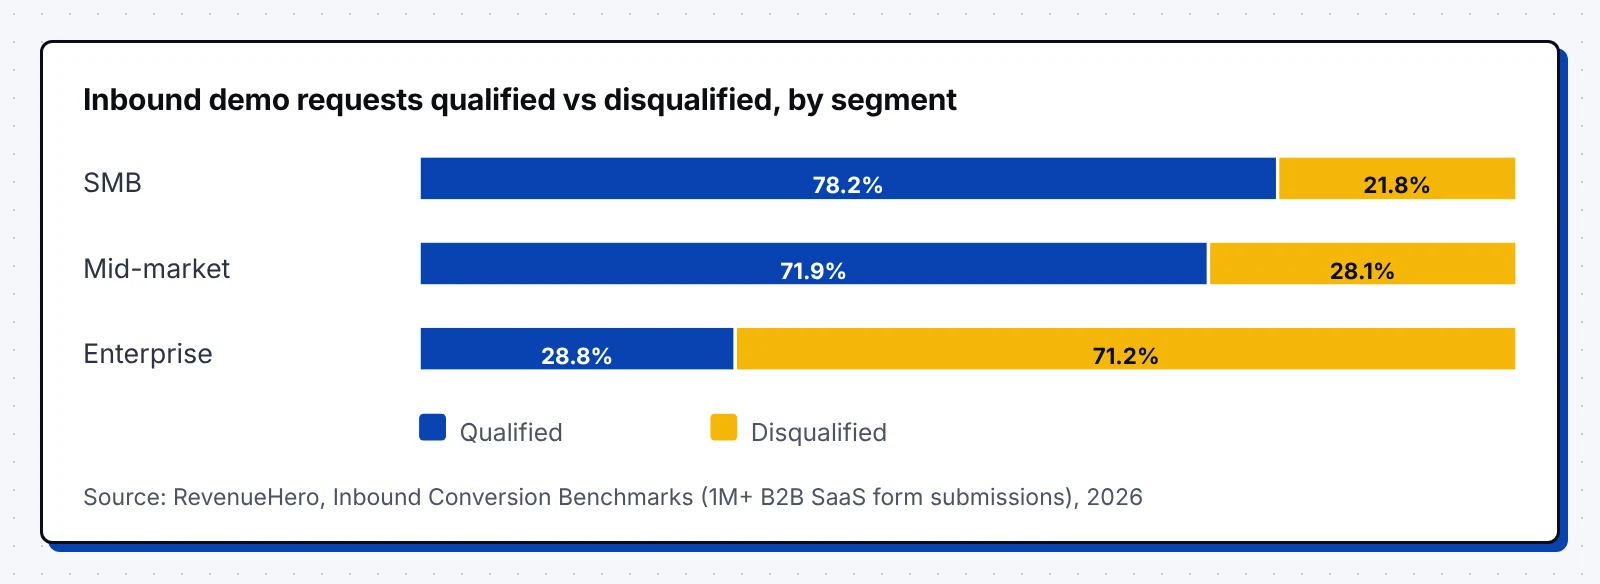
The share of inbound leads that qualify depends most on who you sell to. Across more than a million B2B SaaS form submissions, sales teams disqualified 21.8% of SMB demo requests and 71.2% of enterprise ones (RevenueHero).
Public lead to MQL benchmarks are thin, and each company draws the MQL line in its own place. We gathered the data that exists on industries, channels, the later funnel, scoring, speed to lead and buying groups. We say plainly where it runs out, and every number links to its source.
- Public lead to MQL data is thin, so write down your MQL definition first and compare each quarter with your own past quarters.
- Who you sell to moves qualification most: 71.2% of enterprise demo requests were disqualified, against 21.8% in SMB (RevenueHero).
- MQL quality shows up one step later, where demand gen MQLs became SQLs at 21.55% and lead gen MQLs at 4.93% (HockeyStack).
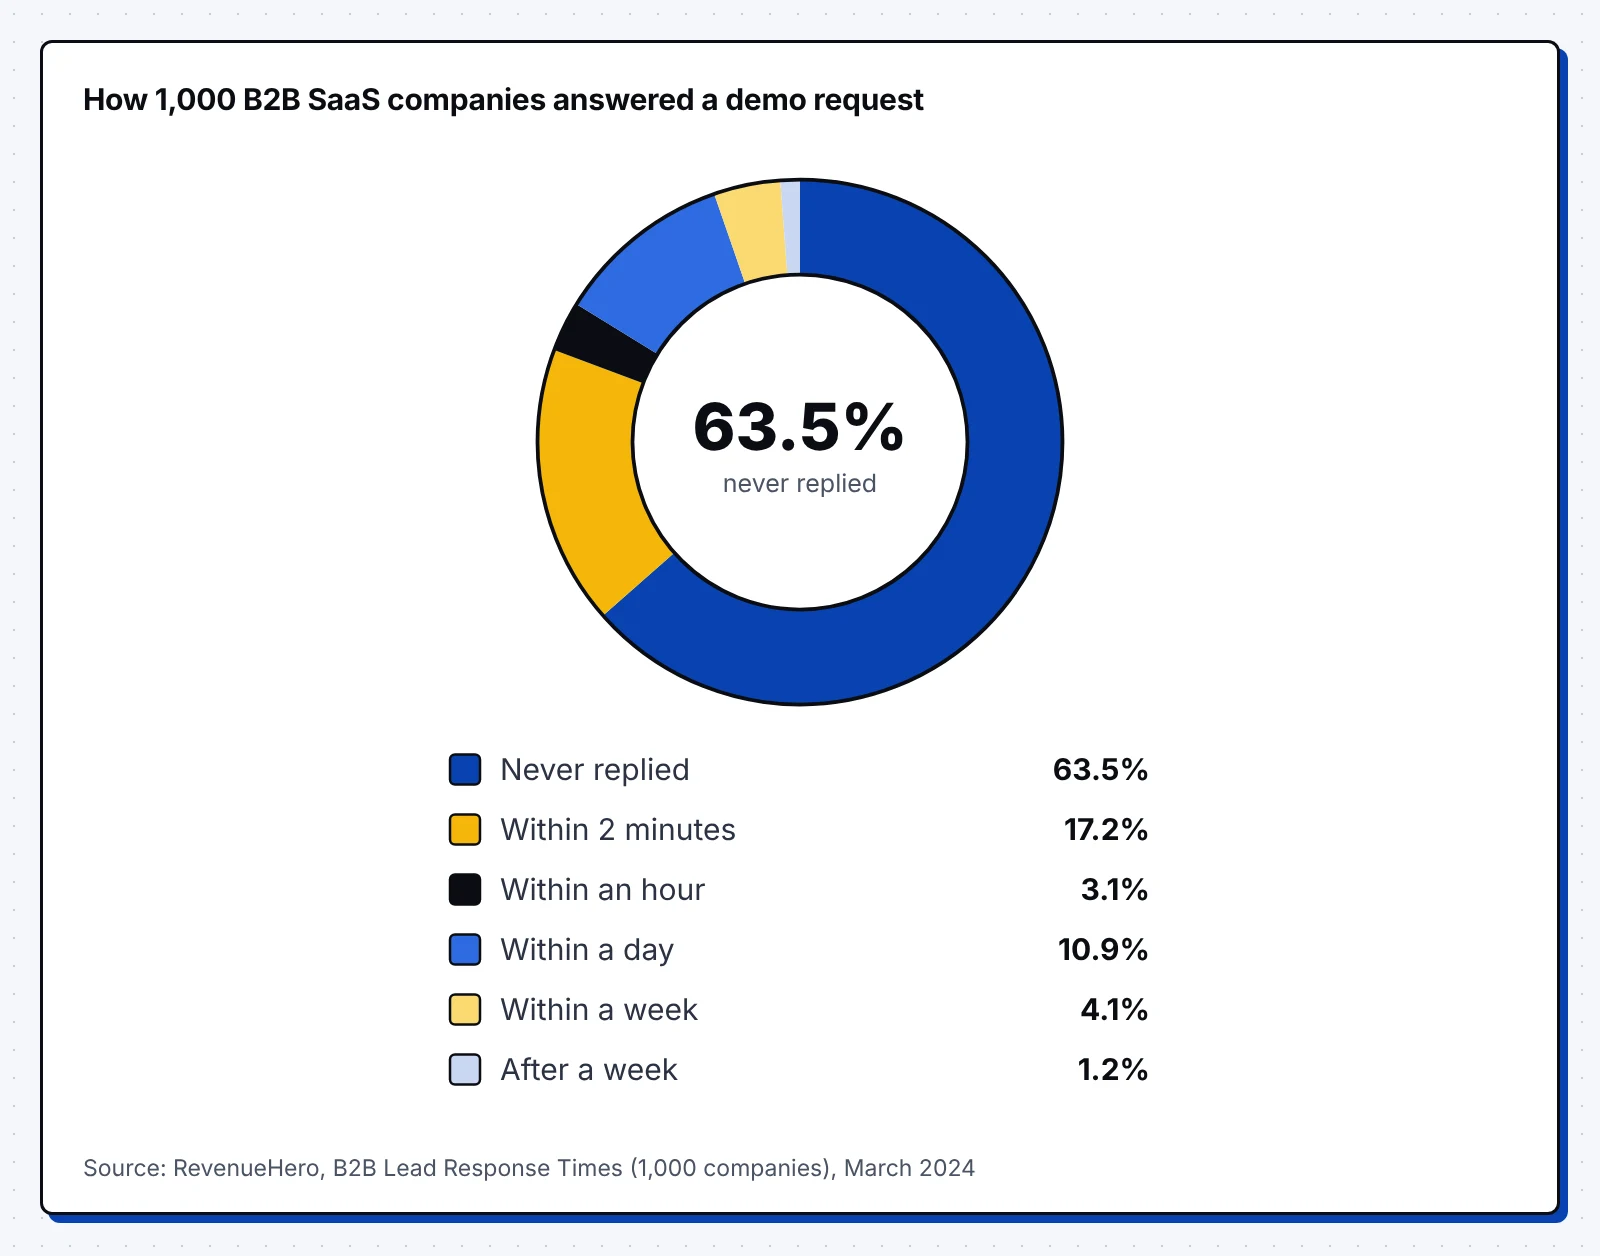
- Speed is the cheapest fix you have, since 63.5% of 1,000 B2B SaaS companies never answered a demo request (RevenueHero).
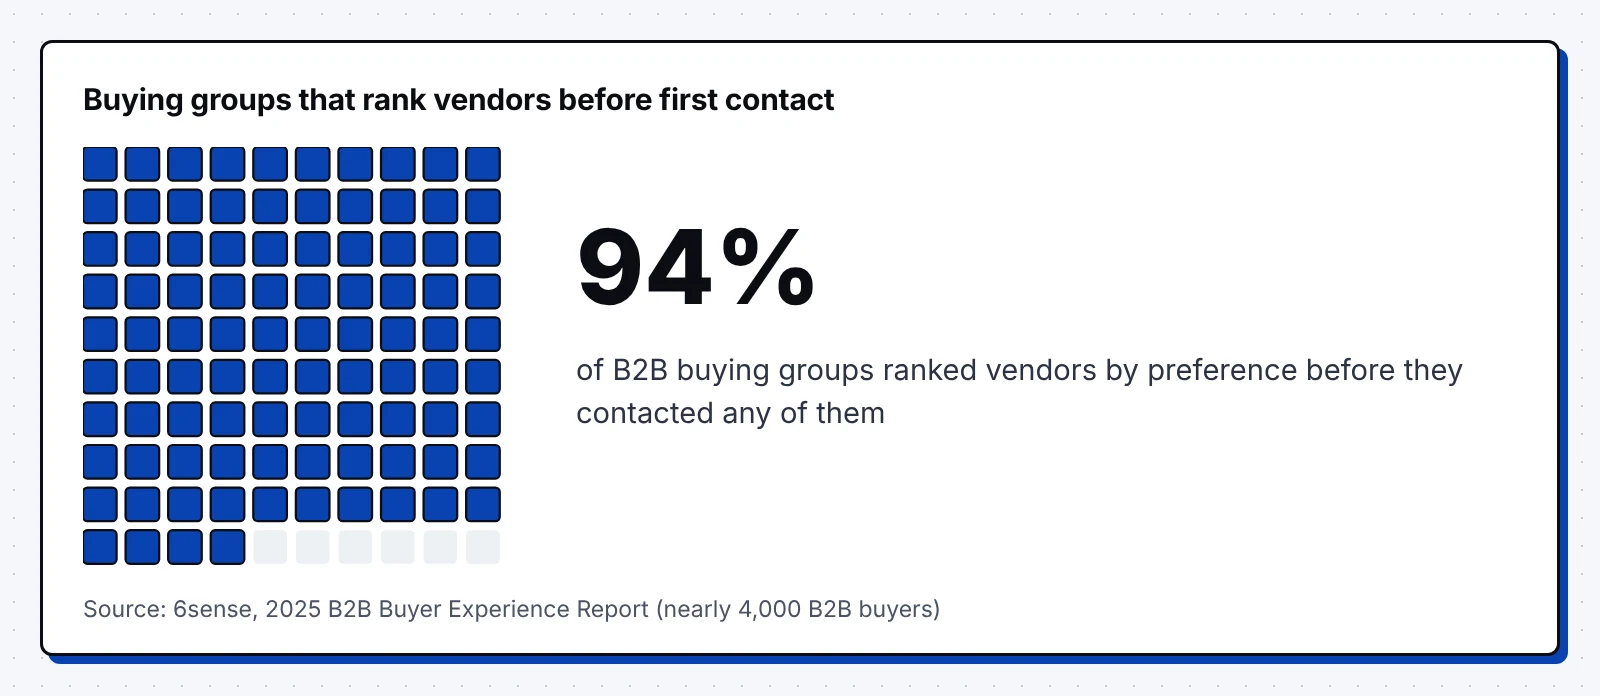
- Buying groups decide early: 94% rank vendors before they contact any of them, so account signals now matter more than single leads (6sense).
What is lead to MQL conversion rate?
Lead to MQL conversion rate is the share of new leads that meet your definition of a marketing qualified lead (MQL) within a set time. An MQL is a lead that fits your ideal customer profile and has shown enough interest for marketing to pass it on.
Count MQLs from the same group of leads you divide by, and give each group the same time to qualify, such as 30 or 60 days. Four choices change the result more than anything else:
- Which leads count, since some teams include every newsletter signup and others count only form fills from business emails.
- Which fit rules apply, such as company size, industry, region and job title.
- Which actions count as interest, such as a demo request, a pricing page visit or a lead score above a set number.
- How long a lead has to qualify before you count it as lost.
Because of these choices, two companies with the same funnel can report very different rates. Compare your rate with your own past quarters first, and use the benchmarks below as a rough check. For the stages before the lead, see our B2B conversion rate benchmarks.
Average lead to MQL conversion rate
Only one public dataset reports lead to MQL rate across industries, and it comes from one agency’s clients. The other numbers here measure the stages on either side of the MQL, which helps you judge whether your own rate makes sense.
- 31% of leads become MQLs on average across industries and channels, where an MQL fits the target market and matches a buyer persona. Rates run from 17% in construction to 45% in solar energy, and B2B SaaS sits at 39%. (First Page Sage)
- 5.13% of website sessions turn into a qualified lead or sale on average across 13 industries, in data from more than 110 million sessions. (Ruler Analytics)
- 6.6% is the median landing page conversion rate across industries, while SaaS landing pages convert at a median of 3.8%. (Unbounce)
- 62% of qualified inbound leads book a meeting at the median B2B SaaS company, and the top 10% of companies reach 78% or more. (RevenueHero)
- Fewer than 1% of leads convert to closed deals, based on 2023 analyst research. (Forrester)
- 1% of all leads converted in the end at one large B2B company in a 2020 case, where sales worked only about half of them. (Bain & Company)
Lead to MQL conversion rate by industry
Lead to MQL rates by industry come only from the client dataset above, so treat them as a rough guide. Visit to qualified lead rates are much better covered, and they show the same wide gaps between industries.
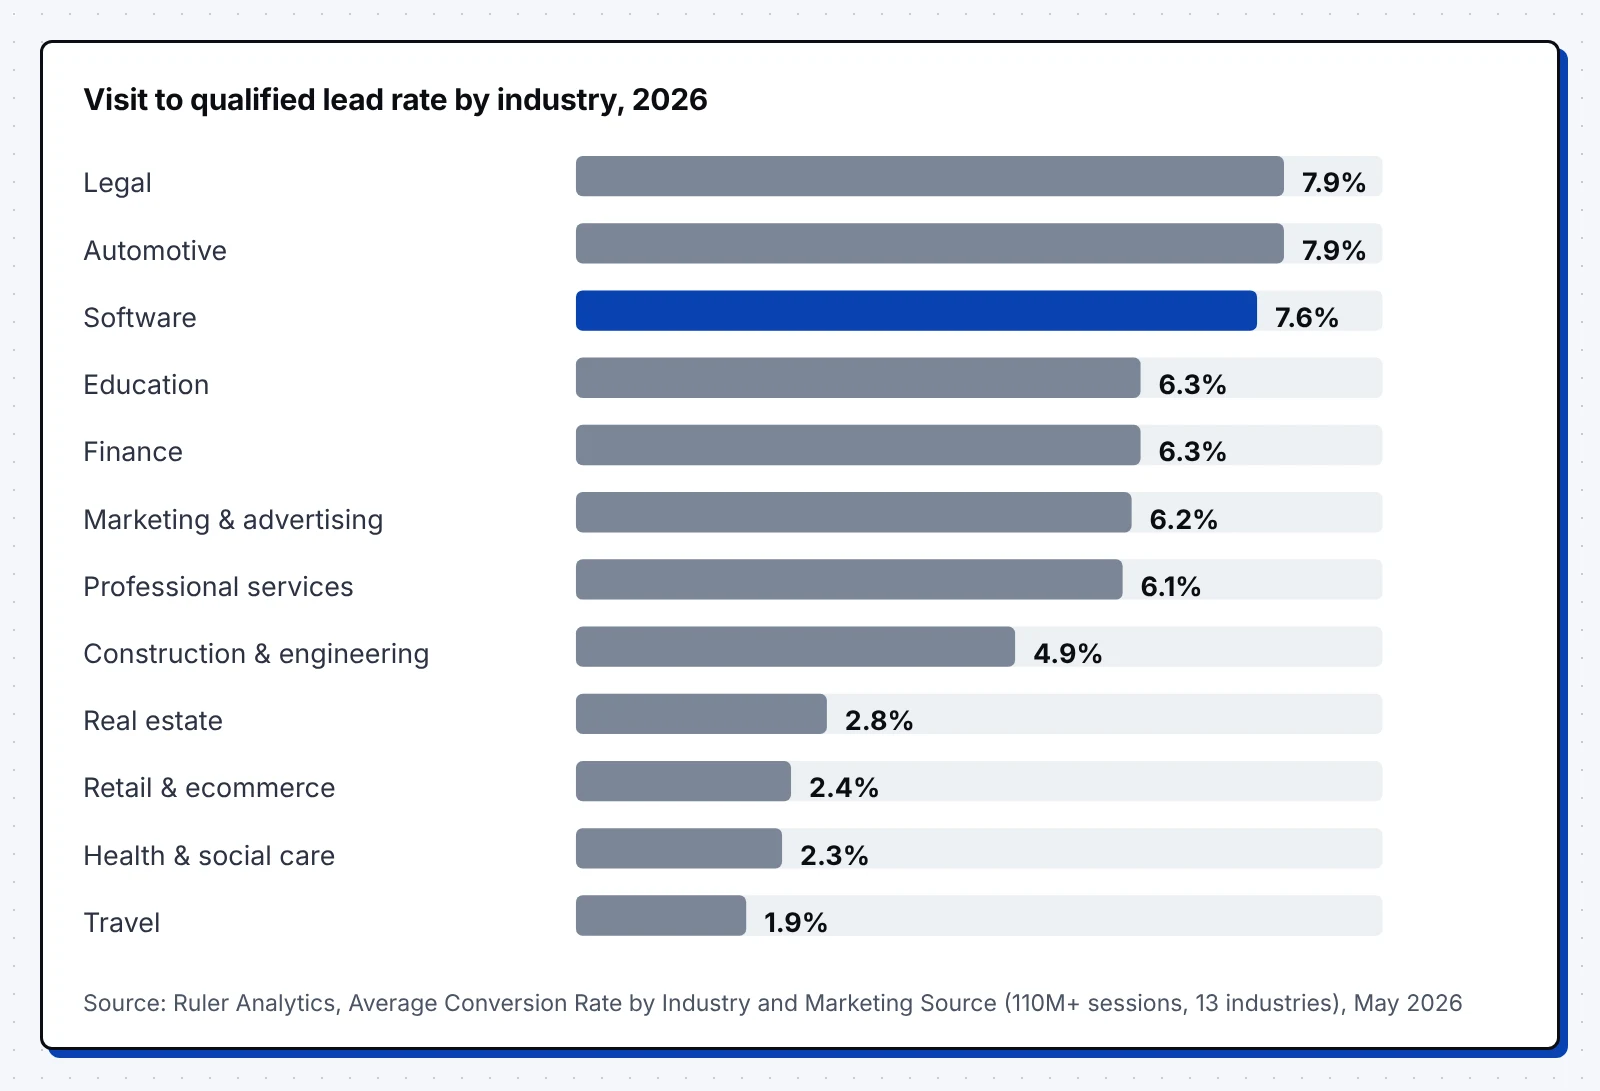
- 7.9% of sessions convert to a qualified lead or sale in legal and in automotive, the highest of 13 industries, with software close behind at 7.6%. (Ruler Analytics)
- 6.3% of sessions convert in finance and in education, against 6.2% in marketing and advertising, 6.1% in professional services and 4.9% in construction and engineering. (Ruler Analytics)
- 1.9% of sessions convert in travel, the lowest of 13 industries, followed by health and social care at 2.3%, retail at 2.4% and real estate at 2.8%. (Ruler Analytics)
- 3.47% of cold emails got a reply in food and beverage in 2025, against 0.56% to 0.60% in construction, financial services, healthcare and legal services. (Belkins)
Thankfully, your own CRM can give you a better industry benchmark than any public report. Split last year’s leads by the industry field and compare their MQL rates side by side. To see what each lead costs by sector, use our cost per lead by industry data.
Lead to MQL conversion rate by channel
Lead to MQL rates by channel also come from that one client dataset, and they show warm sources qualifying far more often than cold ones. Public data is thinnest for referrals and content syndication, so for those we list the closest measures we found.
- 56% of client referral leads become MQLs, the highest of 11 channels, followed by executive events at 54% and SEO at 41%. Webinars (19%) and outdoor ads (14%) qualify least often. (First Page Sage)
- 5.4% of paid search sessions convert to a qualified lead or sale, against 4.9% for organic search and email and 4.8% for referral traffic. (Ruler Analytics)
- 16.9% of email visitors convert on SaaS landing pages at the median, against 4.1% from paid search and 2.9% from paid social. (Unbounce)
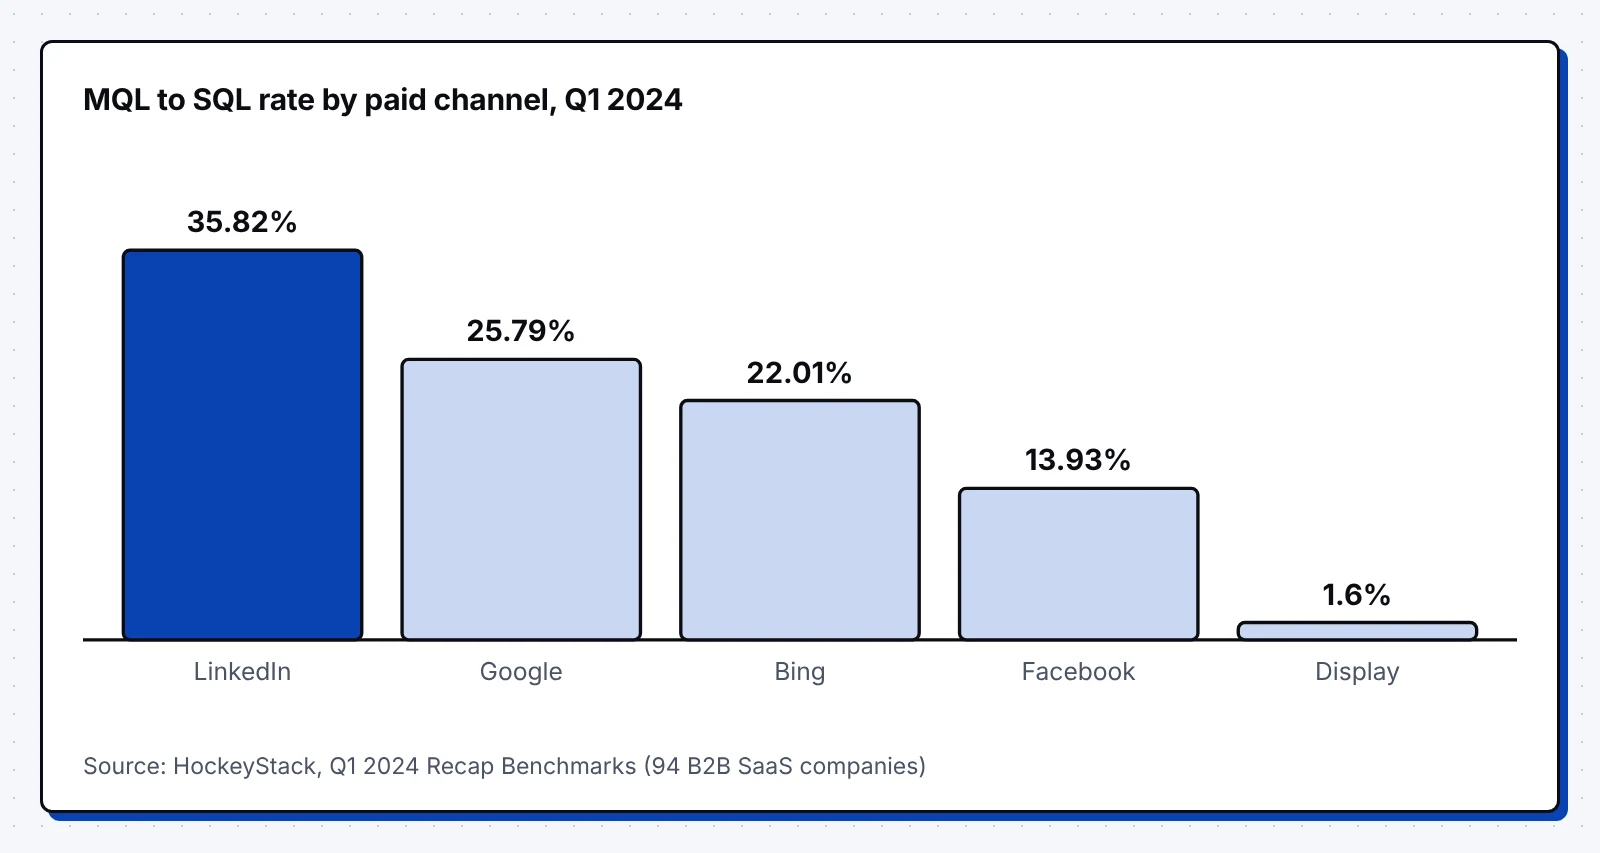
- 35.82% of LinkedIn Ads MQLs became SQLs in Q1 2024, against 25.79% for Google Ads, 22.01% for Bing and 13.93% for Facebook. (HockeyStack)
- 1.6% of display ad MQLs became SQLs in Q1 2024, the lowest of the paid channels tracked across 94 B2B SaaS companies. (HockeyStack)
- 6.41% of deals from virtual events and 5.50% from live events reached the qualified stage, against 4.82% for all other channels. (HockeyStack)
- 0.45% of cold emails got a reply in 2025, across 7.5 million emails, counting unique replies and leaving out auto-replies. (Belkins)
- 39 hours passed on average between a buyer requesting gated B2B content and opening it in 2024, up from 31 hours in 2023. (NetLine)
- 7.9 million B2B content registrations came through one syndication network in 2024, up 27% on 2023. (NetLine)
We found no recent public study that measures how B2B referral leads qualify, beyond the client data above. If referrals matter to you, tag them as their own source in your CRM so you can measure them yourself. Our guide to B2B lead generation covers how to pick and test channels.
MQL to SQL and the rest of the funnel
Lead to MQL is the first of several steps, and the steps after it show whether your MQL bar sits at the right height. A high lead to MQL rate paired with a low MQL to SQL rate usually means the bar is set too low.
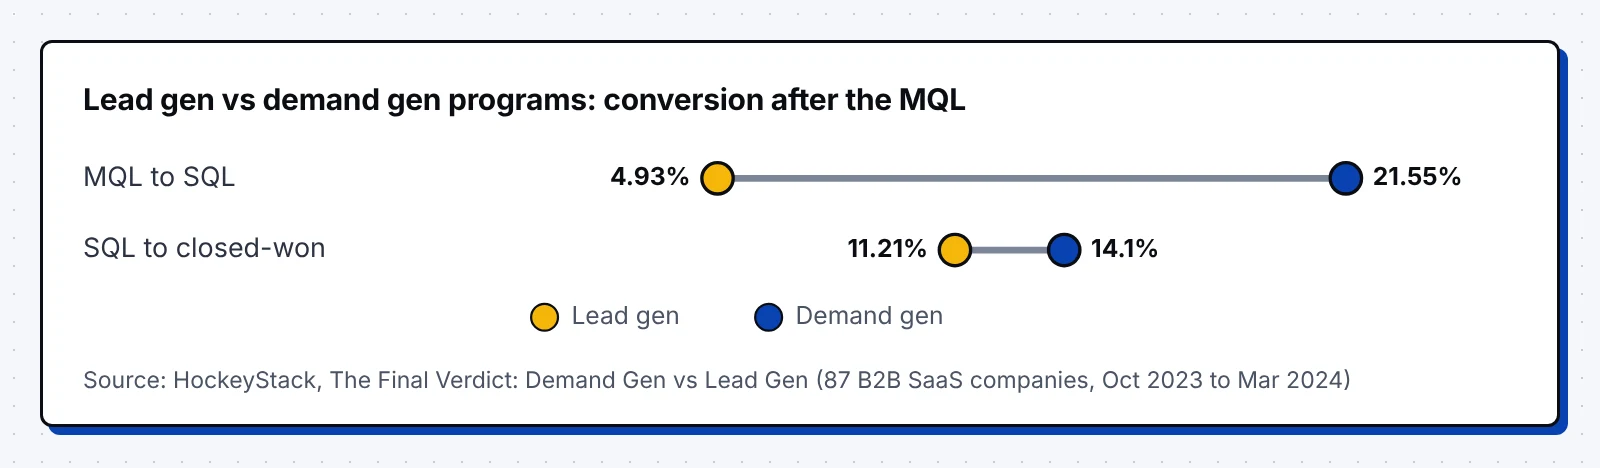
- 21.55% of MQLs became SQLs at companies running demand gen, against 4.93% at companies running lead gen, across 87 B2B SaaS companies. (HockeyStack)
- $262 was the average cost per MQL for lead gen companies, against $570 for demand gen, yet each lead gen SQL cost $5.32K against $2.64K. (HockeyStack)
- 14.1% of demand gen SQLs closed, against 11.21% for lead gen, and demand gen sales cycles averaged 54 days against 88 days. (HockeyStack)
- 3.1x higher win rates come from opportunities that match the ideal customer profile, in data on 4.7 million B2B opportunities. (Ebsta)
- 17% higher closed-won rate followed when Palo Alto Networks moved from MQLs to buying groups, and deals with several contacts were 8x more likely to advance. (Forrester)
- 55% of B2B professionals named a higher MQL to opportunity conversion rate as one of their top three demand gen goals for 2025. (Demand Gen Report)
Luckily, these later rates are easier to track than lead to MQL, because opportunities and closed deals already live in your CRM. Our post on lead generation vs demand generation explains the two approaches behind these numbers.
How lead scoring and MQL definitions change the rate
Your lead to MQL rate mostly reflects where you set the bar. A loose definition raises the rate and moves the drop to MQL to SQL, while strict fit rules lower the rate and raise everything after it.
- 71.2% of enterprise demo requests were disqualified, against 28.1% in mid-market and 21.8% in SMB. That leaves 28.8% of enterprise, 71.9% of mid-market and 78.2% of SMB requests qualified. (RevenueHero)
- 77% of qualified leads booked a meeting from two-field forms, and 76% from 13-field forms, so form length barely changed the result. (RevenueHero)
- 56% of companies still evaluate their leads by hand, in a 2024 survey of 385 companies in Switzerland and Germany. (FHNW)
- 37% of the same companies say passing ready-to-buy leads to sales automatically, based on AI lead scoring, would help them. (FHNW)
- 35% of product-led companies kept product-qualified and marketing-qualified leads in separate scores, in a 2021 survey of 200+ companies. (Pocus)
- 31% of B2B marketers wanted to move away from lead volume and MQL generation toward higher-quality leads in 2025. (Demand Gen Report)
Speed to lead statistics
Speed decides whether a lead that raised a hand ever gets the chance to qualify. Most B2B companies still answer demo requests in hours or days, and many never answer at all.
- 63.5% of 1,000 B2B SaaS companies never answered a demo request in a 2024 test, and those that did took 1 day and 5 hours on average. (RevenueHero)
- 17.2% of the 1,000 companies replied within two minutes, 3.1% within an hour, 10.9% within a day, 4.1% within a week and 1.2% after that. (RevenueHero)
- 17 hours and 20 minutes was the average reply time at companies that automate the first response, against 2 days and 3 hours for manual replies. (RevenueHero)
- More than 99% of 114 B2B companies failed to respond to a demo request within five minutes, and email replies took 11 hours and 54 minutes on average. (Workato)
- 31% of the same companies called the lead at all, and none of them called within five minutes. (Workato)
- 3 hours and 32 minutes was the average response time at companies with a lead routing tool, against nearly 13 hours without one. (Workato)
- 7% of B2B software vendors answered a demo request within 60 seconds in a 2022 test, while nearly 30% never answered. (Chili Piper)
Why MQLs are being replaced
Analysts now argue that the MQL measures the wrong unit, because groups of people make B2B purchases and settle on a favorite before they talk to sales. Buying groups, product-qualified leads (PQLs) and account signals are taking its place, though public conversion data for them is still thin.
- 13 internal stakeholders and 9 external influencers take part in a typical B2B buying decision. (Forrester)
- 46% of B2B buyers bought as a group of two or three people and 28% as a group of four to nine, in data published in 2023. (Forrester)
- 50% higher meeting to closed-won conversion comes from passing three or more buying group members to sales, based on what clients report (2023). (Forrester)
- 94% of buying groups ranked vendors by preference before they contacted any of them, in a survey of nearly 4,000 B2B buyers. (6sense)
- 61% of the way through the buying journey is where buyers first contact a seller on average, down from 69% in earlier studies. (6sense)
- 77% of buying groups bought from the vendor they ranked first, and 79% made the first contact with vendors themselves. (6sense)
- 10.1 months was the average B2B buying cycle in 2025, down from 11.3 months in 2024. (6sense)
- 61% of B2B buyers prefer an overall buying experience without a sales rep, in a survey of 632 buyers. (Gartner)
- 73% of B2B buyers actively avoid suppliers that send irrelevant outreach. (Gartner)
- 69% of B2B buyers find differences between a supplier’s website and what its sellers tell them. (Gartner)
- 46% of product-led companies used sales to nurture or convert product-qualified leads in 2021. (Pocus)
- 1 in 4 SaaS companies had a PQL strategy in 2021, the same share as in 2020. (Growth Unhinged)
- 2.8x higher conversion came from free trials that use PQLs than from trials that do not, in 2022 product data. (Gainsight)
- 5% of potential B2B buyers are in the market at any given time, by the 95:5 rule of thumb from John Dawes of the Ehrenberg-Bass Institute. (Dreamdata)
We found no public, independent benchmark for how intent data or marketing qualified accounts convert to revenue. Until one exists, run any account-based model alongside your MQL for a few quarters and compare the pipeline each one produces.
How to improve your lead to MQL conversion rate
A higher lead to MQL rate only helps when MQL to SQL holds steady or rises with it. These six steps raise the rate by bringing in better leads and handling them faster:
- Write one MQL definition with sales, with fit rules and intent rules, and date every change.
- Measure the rate by monthly cohort and by source, so one channel cannot hide another.
- Score fit before behavior, since ICP fit predicts wins better than downloads.
- Answer demo and contact requests within minutes with routing and a scheduler on the form.
- Move low-intent sources, such as syndicated content and display, into nurture instead of the MQL count.
- Add account and product signals, so a buying group or an active trial can qualify together.
1. Write one MQL definition with sales
Agree on the fit rules (industry, size, region, role) and the intent actions that make a lead an MQL. Write them in one shared document and note the date each time you change them, since a new rule breaks the trend line.
2. Measure by cohort and by source
Count how many of January’s leads became MQLs within 60 days, then repeat for each month and each source. Our guide to B2B website metrics shows how to keep the original source on every lead so this split works.
3. Score fit before behavior
Give fit a gate of its own, so a student who downloads five ebooks never becomes an MQL. Opportunities that match the ideal customer profile win 3.1 times as often, which makes fit the strongest single signal you can add.
4. Answer within minutes
Route demo requests to the right rep the moment the form is sent, and let the buyer book a time on the thank-you page. Companies with a lead routing tool answered in about 3.5 hours instead of 13, and a scheduler lets the buyer book a time without waiting for a reply.
5. Move low-intent sources into nurture
Keep syndicated content, display and broad webinar leads out of the MQL count until they take a buying action. Your rate will look lower at first, and your MQL to SQL rate and sales team’s trust in MQLs will rise.
6. Add account and product signals
Track how many people from one account engage, and treat an active free trial or a pricing page visit as stronger than a content download. Count the result as a qualified account or PQL alongside your MQLs until you know which predicts revenue better.
Worked example
The numbers below are example inputs that only show the math. A SaaS company creates 400 leads a month and uses a loose MQL definition:
- Before: 400 leads, 160 MQLs and 16 SQLs, so lead to MQL is 40% and MQL to SQL is 10%.
- Change: the team adds a fit gate, moves syndicated leads into nurture and routes demo requests to a rep within minutes.
- After: 400 leads, 80 MQLs and 18 SQLs, so lead to MQL falls to 20% and MQL to SQL rises to 22.5%.
- Result: sales works half as many MQLs each month and still gets two more SQLs out of them.
Fortunately, you can run this test on last quarter’s data before you change anything. Apply the new rules to old leads, count how many of the MQLs you would have kept became SQLs, and show sales the result.
How we picked these sources
We opened every source and checked each number on the page we link to, using the original study wherever we could reach it. We picked sources by these rules:
- Data from 2024 to 2026 first, with older studies only where nothing newer exists, and the year named in the stat.
- No more than six stats from any one publisher, so no single dataset sets the picture.
- A note in each link title on the sample, the date and the kind of data.
- No numbers from roundup posts that do not name a primary source.
Most public lead to MQL data comes from vendors and agencies studying their own customers, so samples skew toward B2B SaaS and toward users of their tools. Treat every benchmark here as a range to test against your own data.
FAQ
What is a good lead to MQL conversion rate?
There is no reliable public benchmark that fits every company, because each team sets its own MQL bar. Judge it by the next step: if few MQLs become SQLs, like the 4.93% HockeyStack measured for lead gen programs, your bar is probably too low.
How do you calculate lead to MQL conversion rate?
Divide the MQLs that came from a group of leads by the number of leads in that group, then multiply by 100. For example, 80 MQLs from 400 leads created in March is a 20% lead to MQL rate.
What is the difference between lead to MQL and MQL to SQL?
Lead to MQL measures how many new leads meet marketing’s fit and interest rules. MQL to SQL measures how many of those MQLs sales accepts as real sales opportunities, so it shows whether the MQL bar is set at the right height.
Why are companies moving away from MQLs?
Groups of people make B2B purchases, and an MQL tracks only one of them. Forrester counts 13 internal stakeholders in a typical decision, and 6sense found 94% of buying groups rank vendors before contacting any. Teams now track buying groups, accounts and product usage instead.
How fast should you respond to a new lead?
Respond within minutes, and let buyers book a meeting on the form itself. In a RevenueHero test, 63.5% of 1,000 B2B SaaS companies never answered a demo request, and Workato found more than 99% of 114 companies missed the five-minute mark.
A good next step is to pull last quarter’s leads, apply your MQL definition by source and see which channels qualify and which do not. For the numbers around this step, read our B2B conversion rate benchmarks and our cost per lead by industry data.