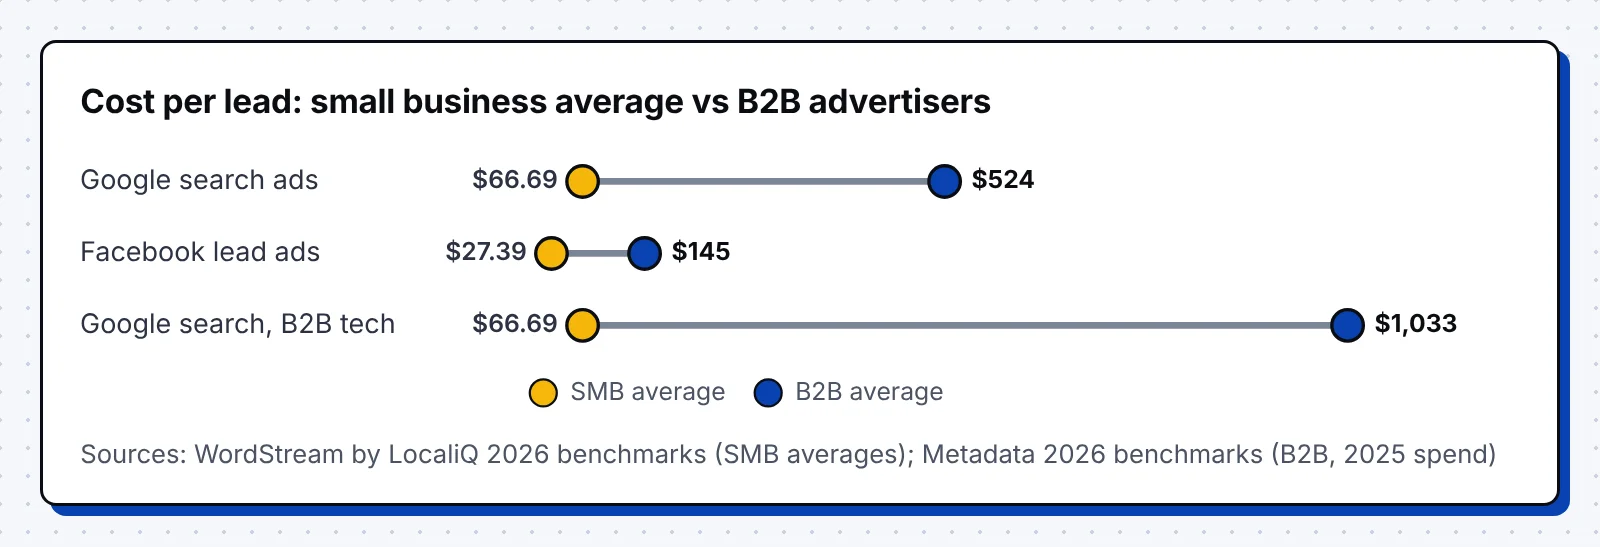
Search ads cost $66.69 per lead on average in 2026, the first drop in five years. B2B advertisers paid far more in 2025, with $202 per LinkedIn lead and $524 per Google Ads lead, so your benchmark depends on who you sell to.
We collected 55 cost per lead benchmarks by industry, channel and funnel stage, each with its year and sample in the link, and the charts use the same numbers. For how paid and organic compare on cost and conversions, see our SEO vs PPC statistics.
- Search ads averaged $66.69 per lead in 2026, from $26.84 in arts and entertainment to $131.63 for attorneys.
- B2B leads cost more on every platform, with $202 on LinkedIn, $524 on Google Ads and $1,033 on Google for B2B tech in 2025.
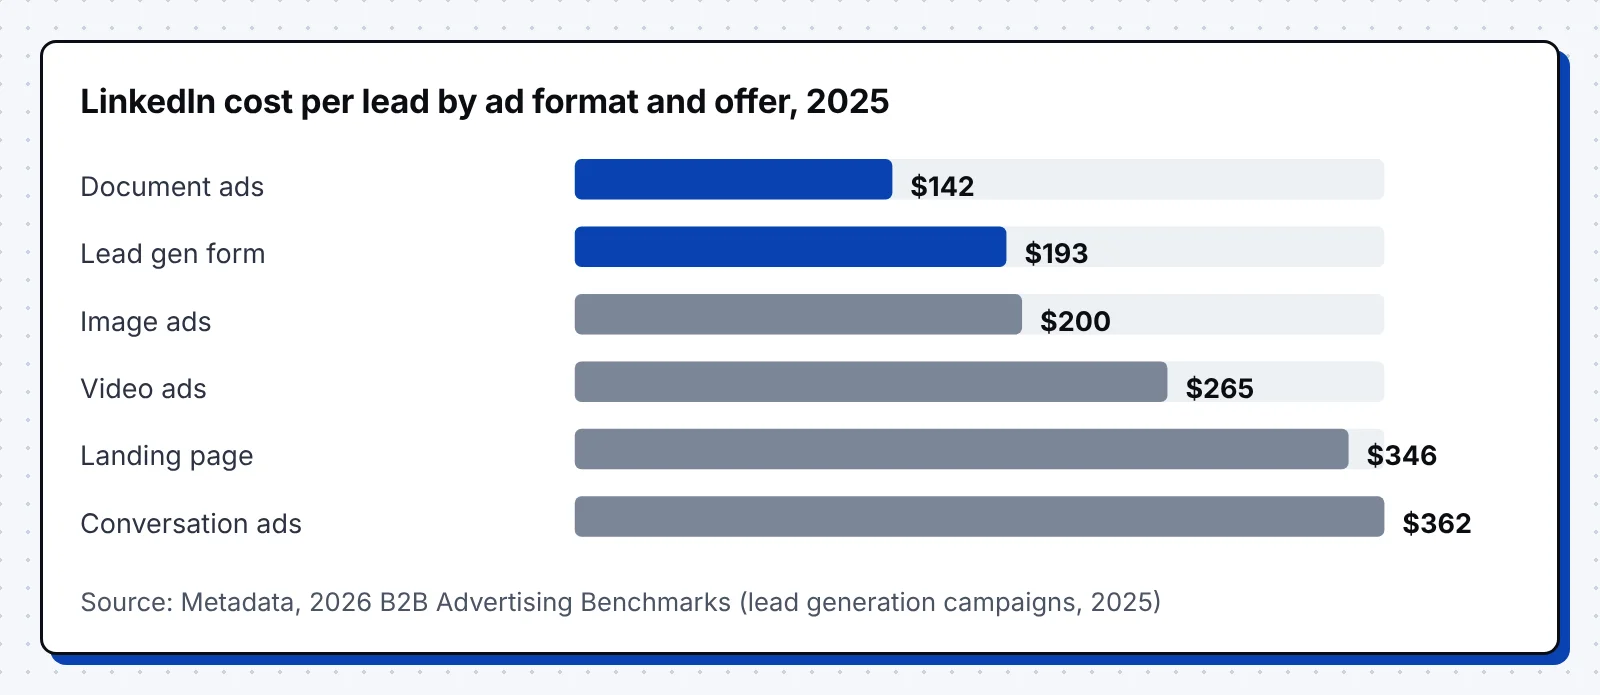
- LinkedIn lead forms cost $193 per lead against $346 for landing pages, and document ads were the cheapest format at $142.
- Search clicks keep getting pricier, while paid social clicks got 18% cheaper in Q2 2026.
- Judge channels on cost per customer, since the median SaaS company needs 16 months to earn back what it spends to win one.
What Is Cost Per Lead and How Do You Calculate It?
Cost per lead (CPL) is what you spend to get one new lead, such as a form fill, a call or a demo request. You work it out by dividing the spend on a channel or campaign by the new leads it brought in over the same period.
Cost per lead = marketing spend ÷ new leads
- A $6,000 monthly Google Ads budget that brings in 80 form fills gives you a cost per lead of $75.
- Count only new contacts, and remove duplicates, spam and existing customers before you divide.
- Add agency fees, tools and content costs when you want a fully loaded cost per lead for planning.
- Keep paid and organic apart, since organic costs are mostly people and content rather than media.
Understandably, most published benchmarks count media spend only, so a fully loaded number from your own books will run higher than the figures below.
Average Cost Per Lead in 2026
There is no single average, because each benchmark divides a different kind of spend by a different kind of lead. Local and small business ads land between $27 and $67 per lead, while B2B paid media runs from $138 to $524.
- $66.69 was the average cost per lead for search ads in 2026, the first drop in the overall average in five years. (WordStream by LocaliQ)
- $5.42 was the average search ad cost per click in 2026, with a 6.64% click-through rate and an 8.18% conversion rate. (WordStream by LocaliQ)
- $27.39 was the average cost per lead for Facebook lead campaigns in 2026, down from $27.66, at an 8.54% conversion rate. (WordStream by LocaliQ)
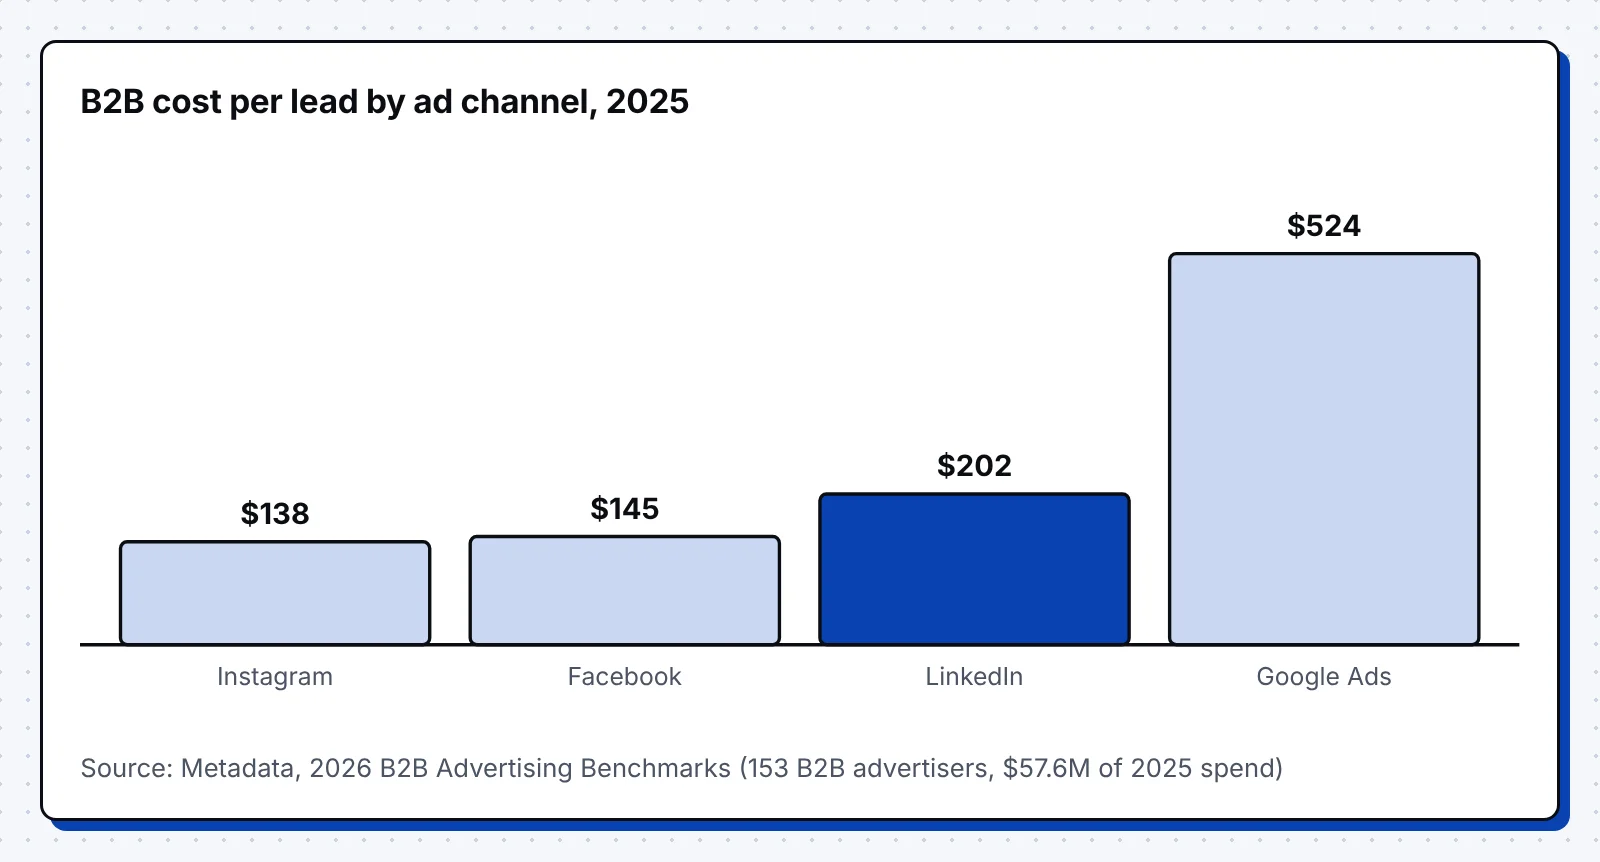
- $202 was the cost of a LinkedIn lead for B2B advertisers in 2025, against $145 on Facebook, $138 on Instagram and $524 on Google Ads. (Metadata)
Cost Per Lead by Industry
Cost per lead follows deal size and competition, so industries where one customer is worth thousands pay the most for each lead. The table puts search, Facebook and blended all-channel figures side by side for B2B and consumer industries.
The three columns measure different costs, so compare figures within a column. Search and Facebook figures count media spend per lead in small business accounts, while the blended column adds organic channels and full marketing costs.
| Industry | Search ads CPL, 2026 | Facebook lead ads CPL, 2026 | Blended CPL, all channels, 2026 |
|---|---|---|---|
| B2B industries | |||
| B2B SaaS | n/a | n/a | $249 |
| IT and managed services | n/a | n/a | $505 |
| Cybersecurity | n/a | n/a | $429 |
| Software development | n/a | n/a | $627 |
| Business services | $93.69 | n/a | n/a |
| Financial services (search: finance and insurance) | $74.44 | n/a | $662 |
| Legal services (search: attorneys) | $131.63 | n/a | $682 |
| Manufacturing (search and Facebook: industrial and commercial) | $75.19 | $35.87 | $547 |
| Engineering | n/a | n/a | $284 |
| Construction | n/a | n/a | $235 |
| Transportation and logistics | n/a | n/a | $604 |
| Staffing and recruiting (search and Facebook: career and employment) | $67.36 | $12.30 | $526 |
| Higher education (search and Facebook: education) | $77.48 | $26.31 | $970 |
| Healthcare (search and Facebook: physicians and surgeons) | $40.04 | $32.14 | $356 |
| Real estate | $102.51 | $13.74 | $472 |
| B2C and local industries | |||
| Dentists and dental services | $72.97 | $61.56 | n/a |
| Home and home improvement | $90.92 | $42.95 | n/a |
| HVAC | n/a | n/a | $96 |
| Furniture | $106.70 | $39.25 | n/a |
| Apparel, fashion and jewelry | $97.51 | n/a | n/a |
| Health and fitness | $67.36 | $27.11 | n/a |
| Beauty and personal care | $39.25 | $50.91 | n/a |
| Automotive (vehicles for sale) | $44.26 | $35.52 | $302 |
| Auto repair, service and parts | $29.96 | n/a | n/a |
| Personal services | $54.60 | $38.09 | n/a |
| Shopping, collectibles and gifts | $49.40 | n/a | n/a |
| eCommerce | n/a | n/a | $96 |
| Travel (blended: hotels and resorts) | $44.70 | n/a | $250 |
| Sports and recreation | $44.26 | $15.49 | n/a |
| Animals and pets | $31.50 | n/a | n/a |
| Restaurants and food | $30.57 | n/a | n/a |
| Arts and entertainment | $26.84 | $14.59 | $115 |
| All industries | $66.69 | $27.39 | $400 |
Sources: search ads from WordStream by LocaliQ Search Advertising Benchmarks 2026; Facebook lead ads from WordStream by LocaliQ Facebook Advertising Benchmarks 2026; blended paid and organic CPL from First Page Sage, Average Cost Per Lead by Industry 2026 (client data from 30 industries, January 2022 to August 2026). n/a means the source doesn't report that industry.
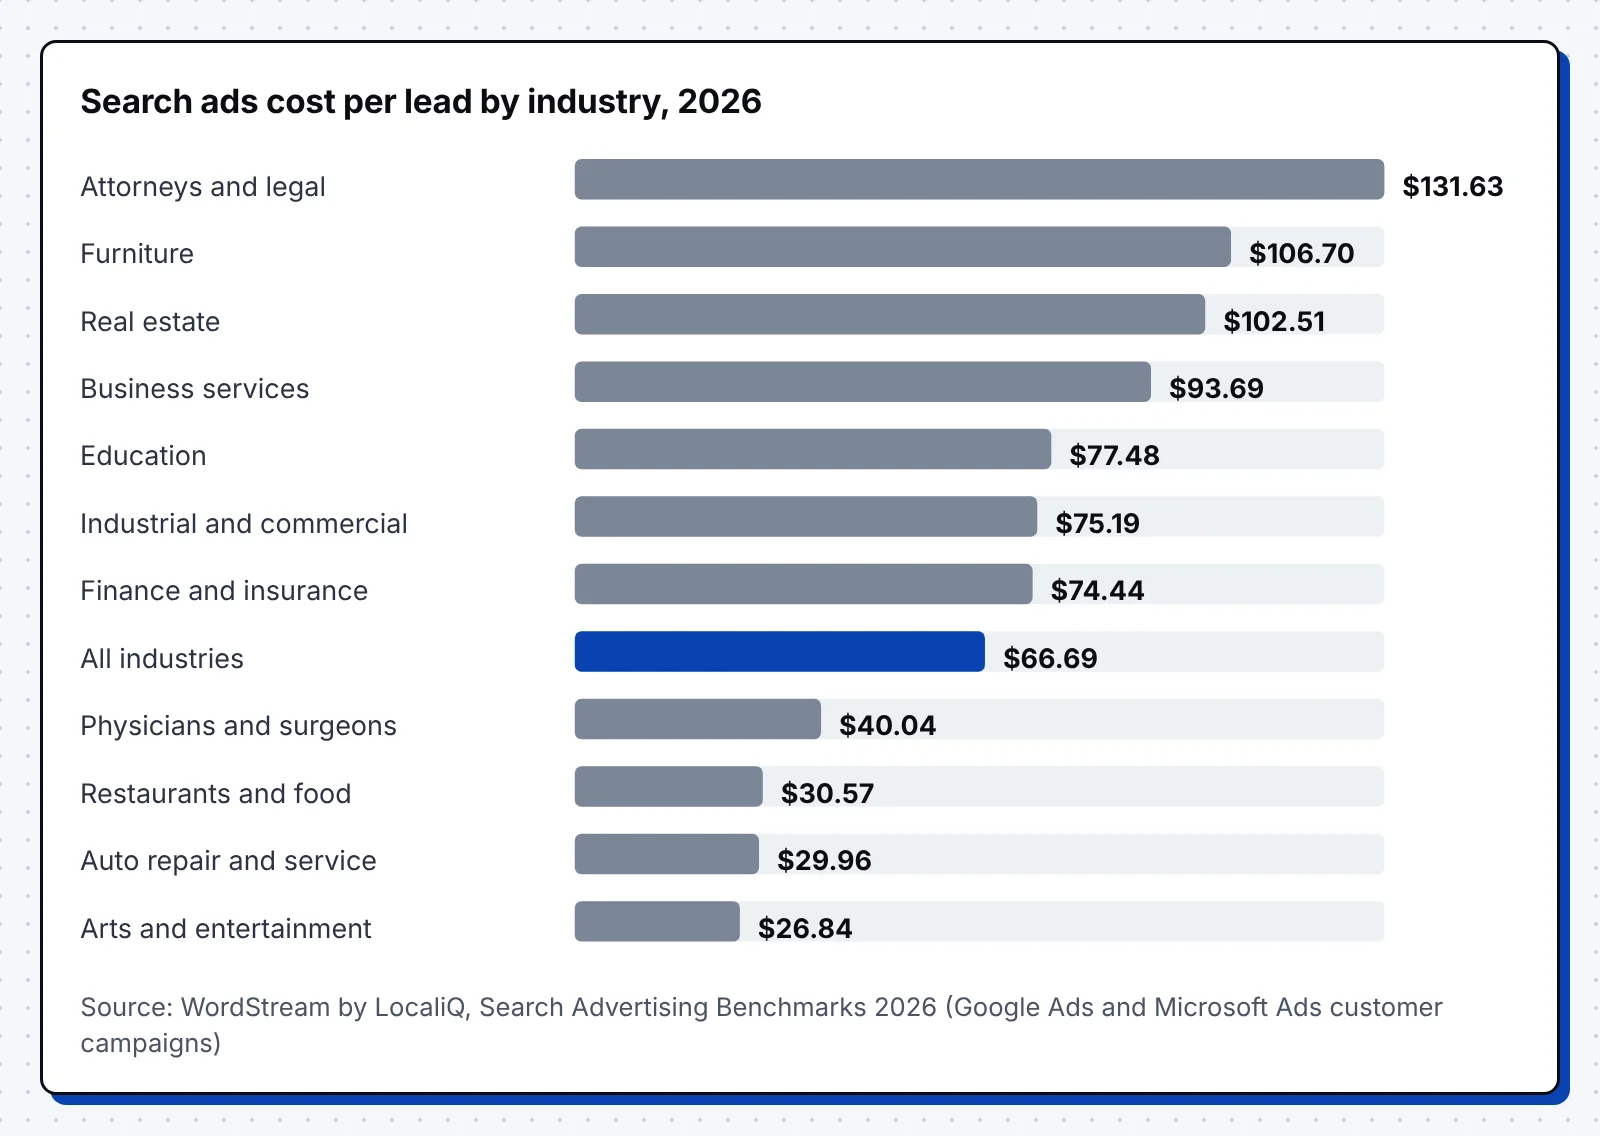
- $131.63 per lead made attorneys and legal services the most expensive search ads category in 2026, ahead of furniture at $106.70 and real estate at $102.51. (WordStream by LocaliQ)
- $93.69 per search lead put business services first among B2B categories in 2026, ahead of education ($77.48), industrial and commercial ($75.19) and finance ($74.44). (WordStream by LocaliQ)
- $26.84 per lead made arts and entertainment the cheapest search category in 2026, with auto repair at $29.96, restaurants at $30.57 and physicians at $40.04. (WordStream by LocaliQ)
- $218 was the cost per lead for B2B tech advertisers across paid channels in 2025, against $297 in financial services and $184 in other industries. (Metadata)
- 7.6% of software website sessions converted in 2026, against 6.3% in finance, 6.1% in professional services and 2.4% in retail and ecommerce. (Ruler Analytics)
Cost Per Lead by Channel
Interestingly, your channel moves cost per lead more than your industry does. Social platforms sell cheap clicks that convert less often, while search sells expensive clicks from people already looking. For click-to-lead rates, see our conversion rate by channel benchmarks.
Google Ads
Google Ads leads cost the most of any paid channel in B2B, since buyers searching for a solution are the most contested audience online.
- $1,033 was the cost per Google Ads lead for B2B tech advertisers in 2025, at a $13.45 cost per click and a 1.3% conversion rate. (Metadata)
- 5.4% of paid search sessions converted in 2026, above organic search, email and referral traffic across 13 industries. (Ruler Analytics)
Microsoft Ads
Microsoft Ads has no public cost per lead benchmark of its own, and the search averages above blend Google and Microsoft campaigns. Its audience is smaller, and its clicks convert less often in landing page data.
- 41% higher conversion rates came from Google search ads than from Bing search ads across industries, with Google pages converting at 11.3% on average. (Unbounce)
- 5.1% of SaaS landing page visits from Google search ads converted in 2024, against 1.9% of visits from Bing ads. (Unbounce)
LinkedIn Ads
LinkedIn clicks cost more than on any other social platform. Thankfully, the native lead form and the right ad format cut its cost per lead sharply.
- 13% was the average conversion rate of LinkedIn Lead Gen Forms in 2017, against 4.02% for landing pages in an Unbounce study. (LinkedIn)
- 90% of LinkedIn Lead Gen Forms pilot customers beat their cost per lead goals, with lower costs than their standard Sponsored Content campaigns. (LinkedIn)
- $193 per lead was the cost of LinkedIn's in-feed lead forms in 2025, against $346 when the same click went to a landing page. (Metadata)
- $142 per lead made document ads the cheapest LinkedIn format in 2025, against $200 for image ads, $265 for video and $362 for conversation ads. (Metadata)
- €5.98 was the average LinkedIn cost per click in 2025, against €1.60 on Meta, while cost per company influenced fell to €70.11 from €154. (Dreamdata)
- $100 a day for at least 4 weeks is LinkedIn's recommended budget when you start a lead or conversion campaign. (LinkedIn)
- $10 is the minimum daily budget for any LinkedIn ad format, and new campaigns need a minimum lifetime budget of $100. (LinkedIn)
Meta (Facebook and Instagram)
Facebook and Instagram give the cheapest paid leads for local businesses and B2B advertisers alike. Their leads show lower intent, so the share that qualifies matters more here than on search.
SEO and content
SEO and content leads cost mostly people and time, so they look cheap per lead once pages rank. The gap with paid channels is narrowing as AI answers take a share of search clicks.
- $350 was the average organic cost per lead across 30 industries in 2026, below $452 for paid, though organic CPL rose 7.3% in a year. (First Page Sage)
- 30.2% of B2B marketers name their website, blog and SEO as a top ROI channel in 2026, ahead of email at 23.6%. (HubSpot)
- 4.9% of organic search sessions converted into leads in 2026, the same rate as email traffic across 13 industries. (Ruler Analytics)
- 40% of B2B marketers say creating content that prompts action, such as a conversion, is their most common content challenge. (Content Marketing Institute)
Email works on contacts you already have, so its cost per lead depends on what you spent to grow the list. Happily, its conversion rates are among the highest of any channel.
- 35% of marketing leaders get $10 to $36 back for every $1 spent on email, and 30% get $36 to $50. (Litmus)
- 21% of marketing leaders don't measure the ROI of their email marketing, down from 36% in 2023. (Litmus)
- 19.3% of landing page visitors from email converted in 2024, the highest of any channel and 77% more than visitors from paid search. (Unbounce)
Events and trade shows
Trade shows and conferences carry high costs per lead in most budgets, yet organizers still rank them as their strongest channel.
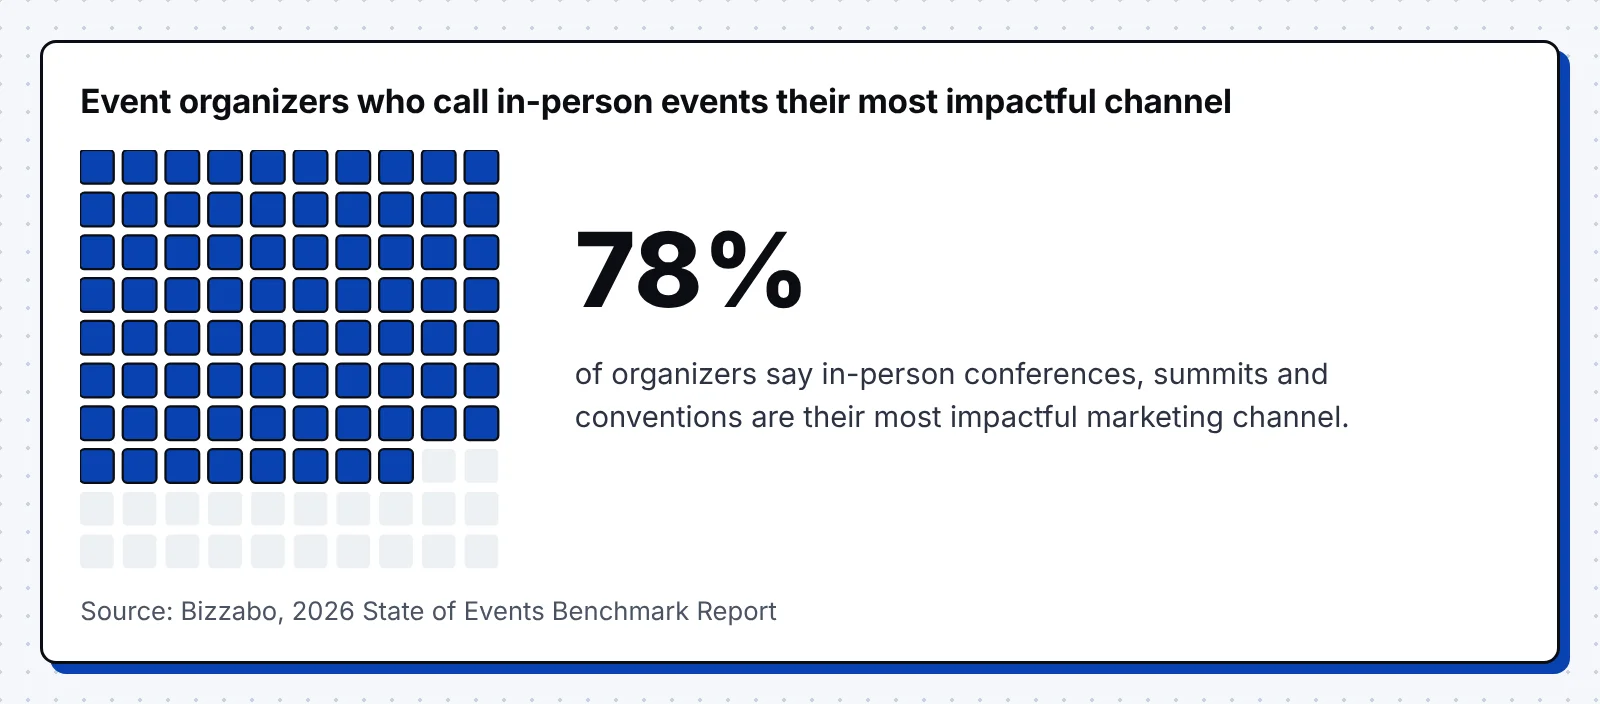
- 78% of event organizers say in-person conferences, summits and conventions are their organization's most impactful marketing channel. (Bizzabo)
- 40% of event organizers report difficulty proving event ROI in 2026, down from 70% in 2025. (Bizzabo)
- 21.5% of event page visits turned into registrations, and dynamic registration flows converted at 24.4% against 11.6% for static ones. (Bizzabo)
Webinars
Webinars sit between content and events, since the registration form creates the lead and attendance decides how many of those leads reach sales.
- 2.2 million people attended 26,190 B2B webinars run by 522 organizations, out of 6.8 million registrations. (Goldcast)
- 91% of on-demand webinar viewers watch nearly the entire recording, a higher completion rate than live attendees. (Goldcast)
- 61% of event organizers report higher webinar attendance than a year earlier, and 53% of attendees plan to attend more webinars in 2026. (Bizzabo)
B2B vs B2C Cost Per Lead
B2B leads cost several times more than leads for local and consumer businesses on the same platforms. Bigger buying groups, smaller audiences and longer sales cycles all push the price of each lead up.
- 13 internal stakeholders and nine external influencers now take part in a typical B2B buying decision, and more for complex purchases. (Forrester)
- 28.5% of B2C marketers name paid social as a top ROI channel in 2026, the most common choice among consumer brands. (HubSpot)
- 3.8% was the median conversion rate for SaaS landing pages in 2024, 42% lower than the 6.6% median across all industries. (Unbounce)
- 81% of the B2B customer journey now happens outside the sales pipeline, up from 70% a year earlier. (Dreamdata)
Cost Per MQL, SQL and Opportunity
Cost per lead is the first in a chain of costs. Each later stage divides the same spend by fewer people, so cost per SQL and cost per customer show which channel pays. For stage conversion rates, see our lead to MQL conversion rate benchmarks.
- Cost per MQL is your spend divided by the leads marketing marks as qualified.
- Cost per SQL is your spend divided by the leads sales accepts and starts working.
- Cost per opportunity is your spend divided by the deals sales opens in the CRM.
- $31k per customer was LinkedIn's 2025 cost for targets with 51 to 200 employees, against $103k at 501 to 1,000 and $78k at 1,001 to 5,000. (Metadata)
- 62% of qualified inbound leads book a meeting at the median B2B SaaS company, and the top 10% book 78% or more. (RevenueHero)
- 37.7% of inbound leads get disqualified at top-quartile companies, twice the 18.7% rate in the bottom quartile. (RevenueHero)
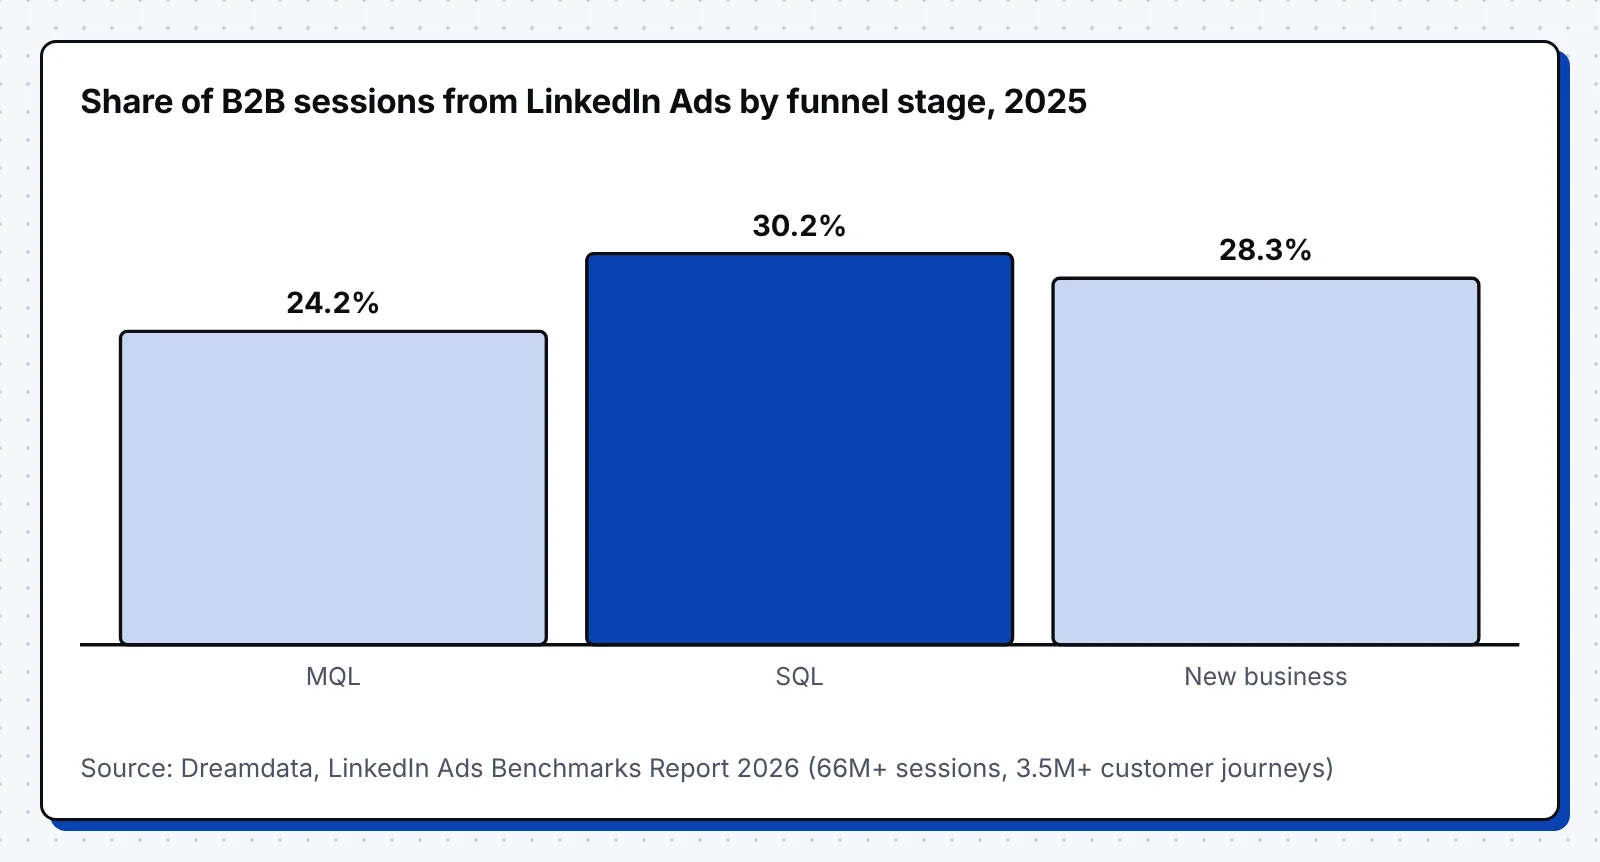
- 24.2% of B2B sessions at the MQL stage come from LinkedIn Ads, rising to 30.2% at SQL and 28.3% at new business. (Dreamdata)
- 16 months is the median time B2B SaaS companies need to earn back customer acquisition cost, down from 18 months in 2024. (Aleph and Benchmarkit)
- 4.1x was the median ratio of customer lifetime value to acquisition cost among B2B SaaS companies in 2025. (Aleph and Benchmarkit)
- 3.1x higher win rates came from opportunities that matched the ideal customer profile, yet only 18% of 2024 pipeline matched it. (Ebsta and Pavilion)
To turn these numbers into a CAC and payback plan, see our guide to B2B customer acquisition strategy.
What Drives Cost Per Lead Up or Down
Three forces set most of the movement in cost per lead: what clicks cost, how many searches end without a click and how well your pages convert. Search ads showed all three in 2026, when clicks cost more but better conversion rates still lowered cost per lead.
- 17% more went into paid search in Q2 2026 than a year earlier, while clicks stayed roughly flat and cost per click kept rising. (Skai)
- 29% higher costs per click hit non-branded B2B search terms, as their share of B2B ad budgets fell from 37% in 2024 to 33% in 2025. (Dreamdata)
- 21.8% was the paid click-through rate on Google queries without an AI Overview in February 2026, down from 26% in January 2025. (Seer Interactive)
- 8% of Google visits with an AI summary led to a click on a regular result in March 2025, against 15% of visits without one. (Pew Research Center)
How to Lower Your Cost Per Lead
Fortunately, you can lower cost per lead by raising conversion rates and cutting wasted clicks, which works better than simply bidding less. These changes have the strongest evidence behind them.
- Send LinkedIn traffic to native lead forms and test document ads for your gated content.
- Track phone calls as leads, especially in legal, professional services and healthcare.
- Write landing pages in short words and sentences, and drop form fields that don't help routing.
- Exclude existing customers, job seekers and poor-fit regions from your paid audiences.
- Import CRM outcomes into your ad platforms so bidding learns from leads that reach sales.
- 11.1% of visitors converted on landing pages written at a 5th to 7th grade level, against 5.3% for professional-level writing. (Unbounce)
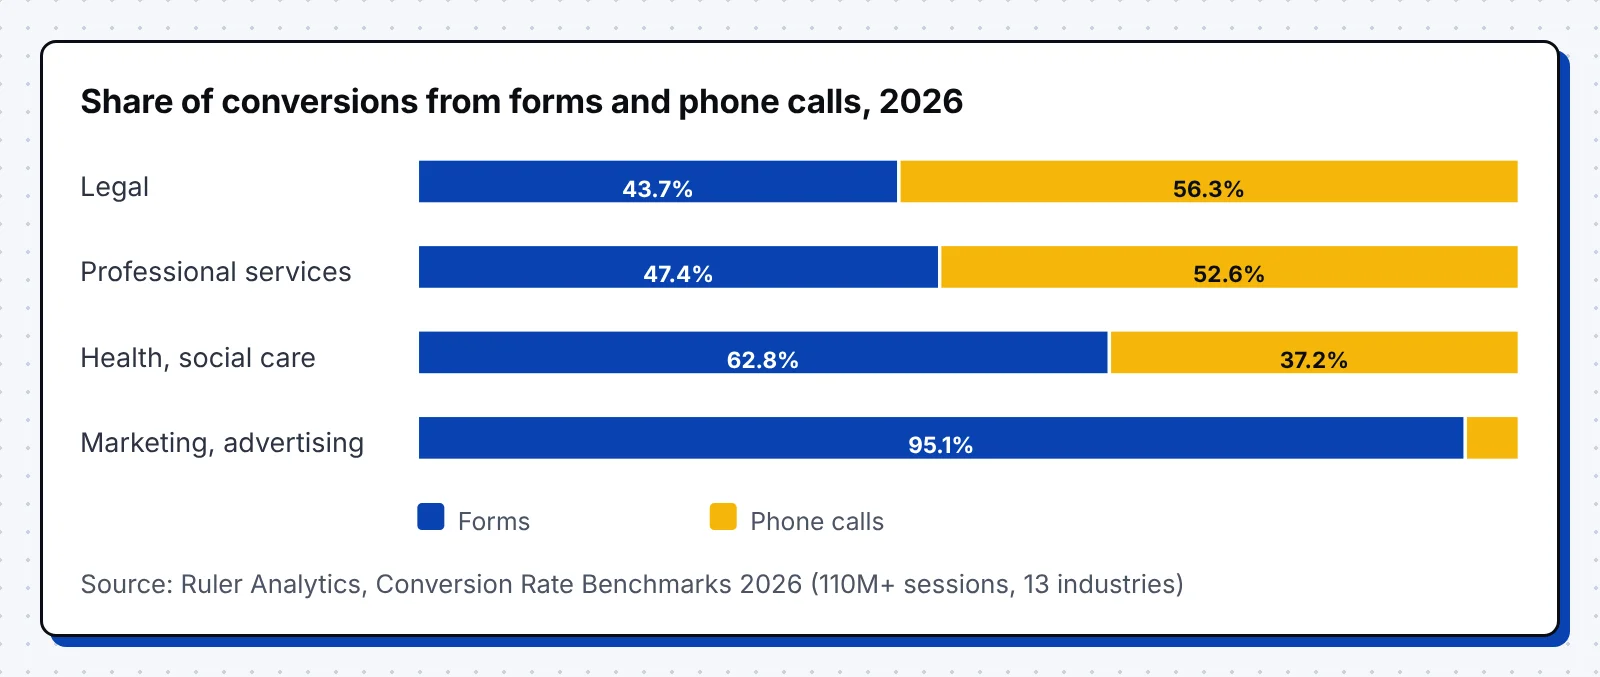
- 56.3% of legal conversions came by phone, as did 52.6% in professional services and 37.2% in health and social care, against 4.9% in marketing and advertising. (Ruler Analytics)
- 121% was LinkedIn's average return on ad spend in 2025, rising to 279% for top performers, whose Meta and Google Search returns were 133% and 138%. (Dreamdata)
How to Use These Benchmarks
Benchmarks tell you where to look first, and your own CRM data tells you what to change. These steps turn the numbers above into a budget decision.
- Pick the benchmark that matches your business, such as small business search figures for local services or B2B paid media figures for software.
- Work out your own cost per lead for each channel over the last 90 days, using one lead definition everywhere.
- Follow each channel's leads to MQL, SQL and closed deals in your CRM, then work out cost per SQL and cost per customer.
- Compare channels on cost per customer and payback, and move budget only when a gap holds for two quarters.
- Check your numbers again every six months, since click prices and AI answers shift these benchmarks quickly.
How We Picked These Sources
We used reports published in 2025 and 2026 wherever we could, and we opened every source and took each number from the original page. Older figures, such as LinkedIn's 2017 Lead Gen Form rate, appear only where no newer number exists.
- We preferred data from real ad accounts and analytics platforms over surveys, and each link names its sample.
- No single publisher supplies more than six stats, so one dataset can't set the whole picture.
- We kept small business search benchmarks and B2B paid media benchmarks apart, since they count different leads.
- We left out figures we couldn't trace to a primary source, including a cost per lead for Microsoft Ads alone.
FAQ
What is a good cost per lead?
A good cost per lead is one that still gives you a profitable cost per customer after your close rates. As a reference, search ads averaged $66.69 per lead in 2026, and B2B advertisers paid $202 on LinkedIn and $524 on Google Ads in 2025.
What is the average cost per lead for B2B companies?
B2B advertisers paid between $138 and $524 per lead in 2025 depending on the channel, with LinkedIn at $202. B2B tech companies paid $218 per lead across paid channels and $1,033 on Google Ads.
Which industry has the highest cost per lead?
Attorneys and legal services pay the most for search ads, at $131.63 per lead in 2026, followed by furniture at $106.70 and real estate at $102.51. In B2B paid media, financial services paid $297 per lead in 2025, above B2B tech at $218.
Which channel has the lowest cost per lead?
Facebook lead campaigns had the lowest paid cost per lead for small businesses, at $27.39 in 2026. For B2B advertisers, Instagram at $138 and Facebook at $145 cost less per lead than LinkedIn at $202, though LinkedIn Ads make up a larger share of B2B sessions at the SQL stage than at MQL.
How do you calculate cost per lead?
Divide your marketing spend by the number of new leads from the same period. A $6,000 monthly budget that brings in 80 form fills gives a cost per lead of $75.
Is cost per lead going up in 2026?
Search ad cost per lead fell in 2026 for the first time in five years, because conversion rates rose faster than click prices. Clicks still cost more, with paid search spend up 17% in Q2 2026 while clicks stayed flat.
A good next step is to pull last quarter's spend, leads and closed deals by channel and set them beside these benchmarks. If your paid channels look expensive next to your close rates, our B2B paid ads agency team can rebuild your campaigns around cost per customer.
To keep learning, read our conversion rate by channel benchmarks, our lead to MQL conversion rate guide and our SEO vs PPC statistics.