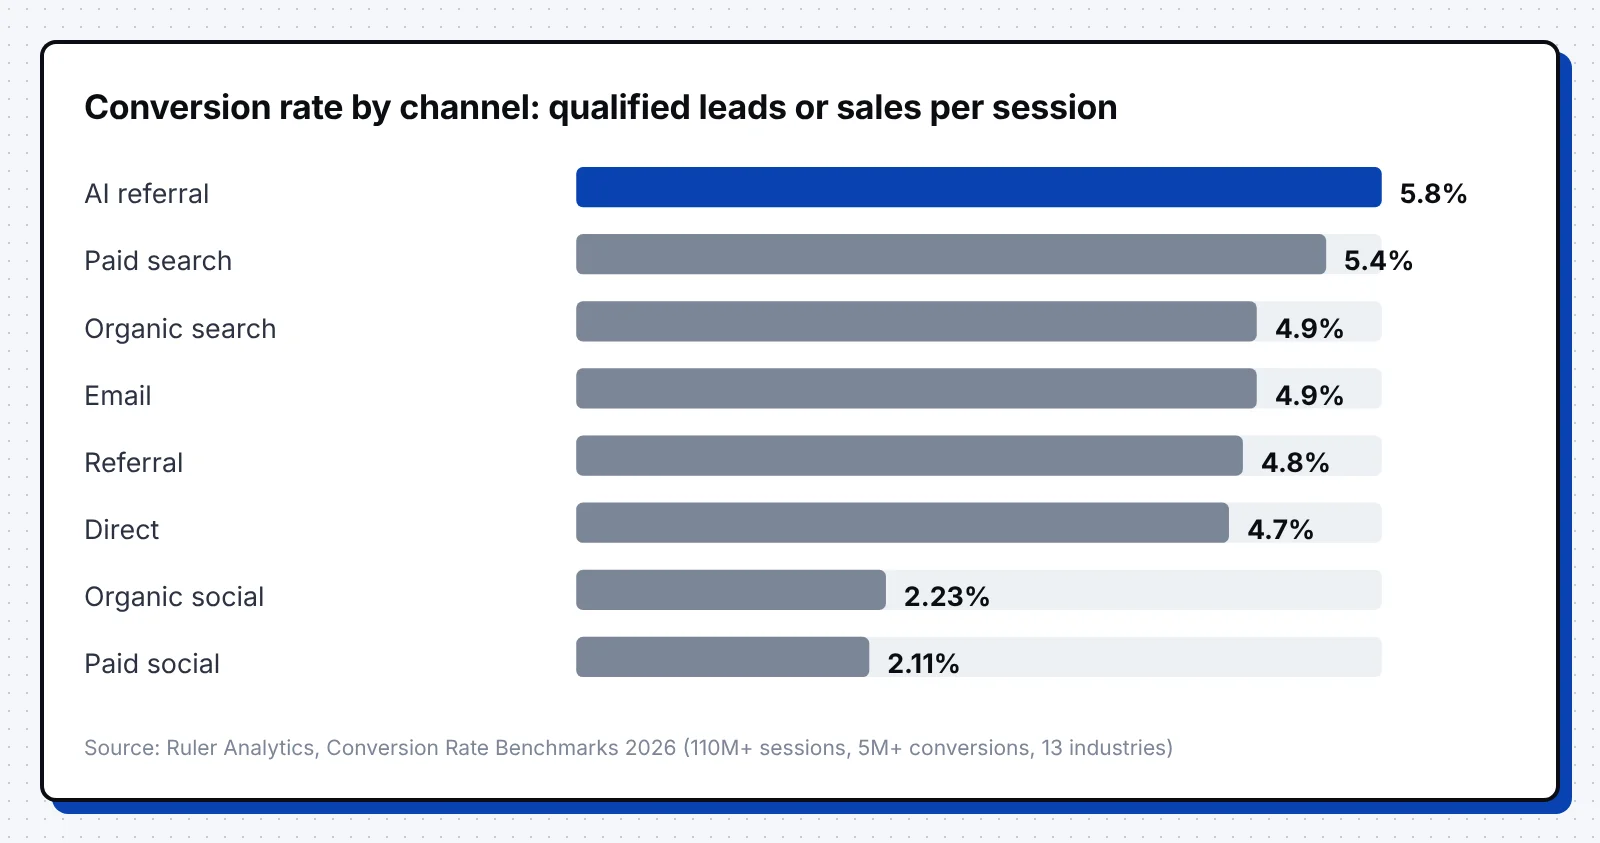
Across 110 million sessions in 13 industries, websites turn 5.13% of visits into a qualified lead or sale. AI referrals convert best at 5.8%, paid search follows at 5.4%, and organic and paid social sit near 2.2%.
Every channel benchmark depends on what a study counts as a visit and a conversion, which is why published rates run from below 1% to 19.3%. We collected 59 sourced numbers by channel, so you can compare your rates with a study that measures them the same way.
- Most channels turn 4.7% to 5.8% of sessions into a qualified lead or sale, while organic and paid social convert near 2.2% (Ruler Analytics).
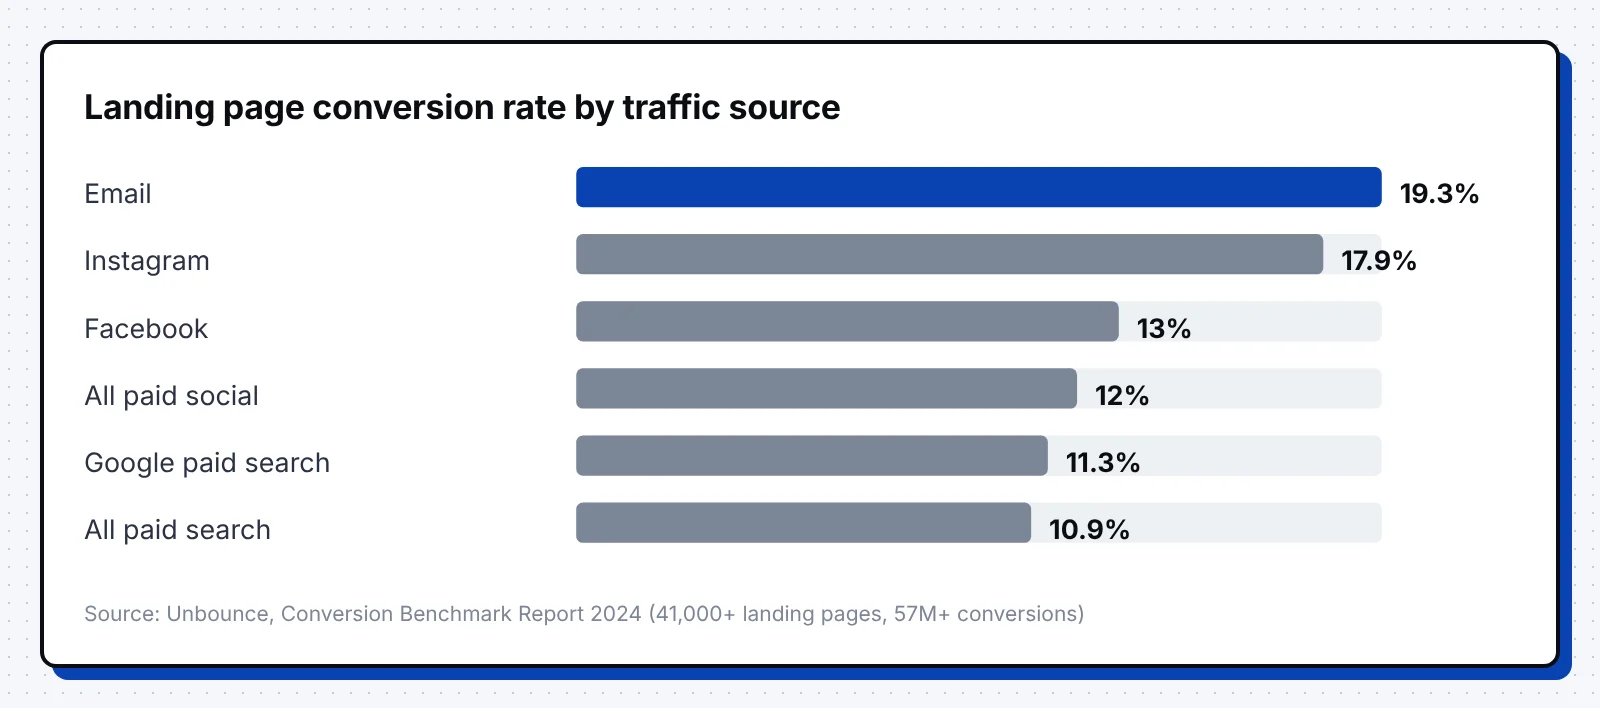
- Email brings the best landing page traffic, converting 19.3% of visitors against 10.9% for paid search (Unbounce).
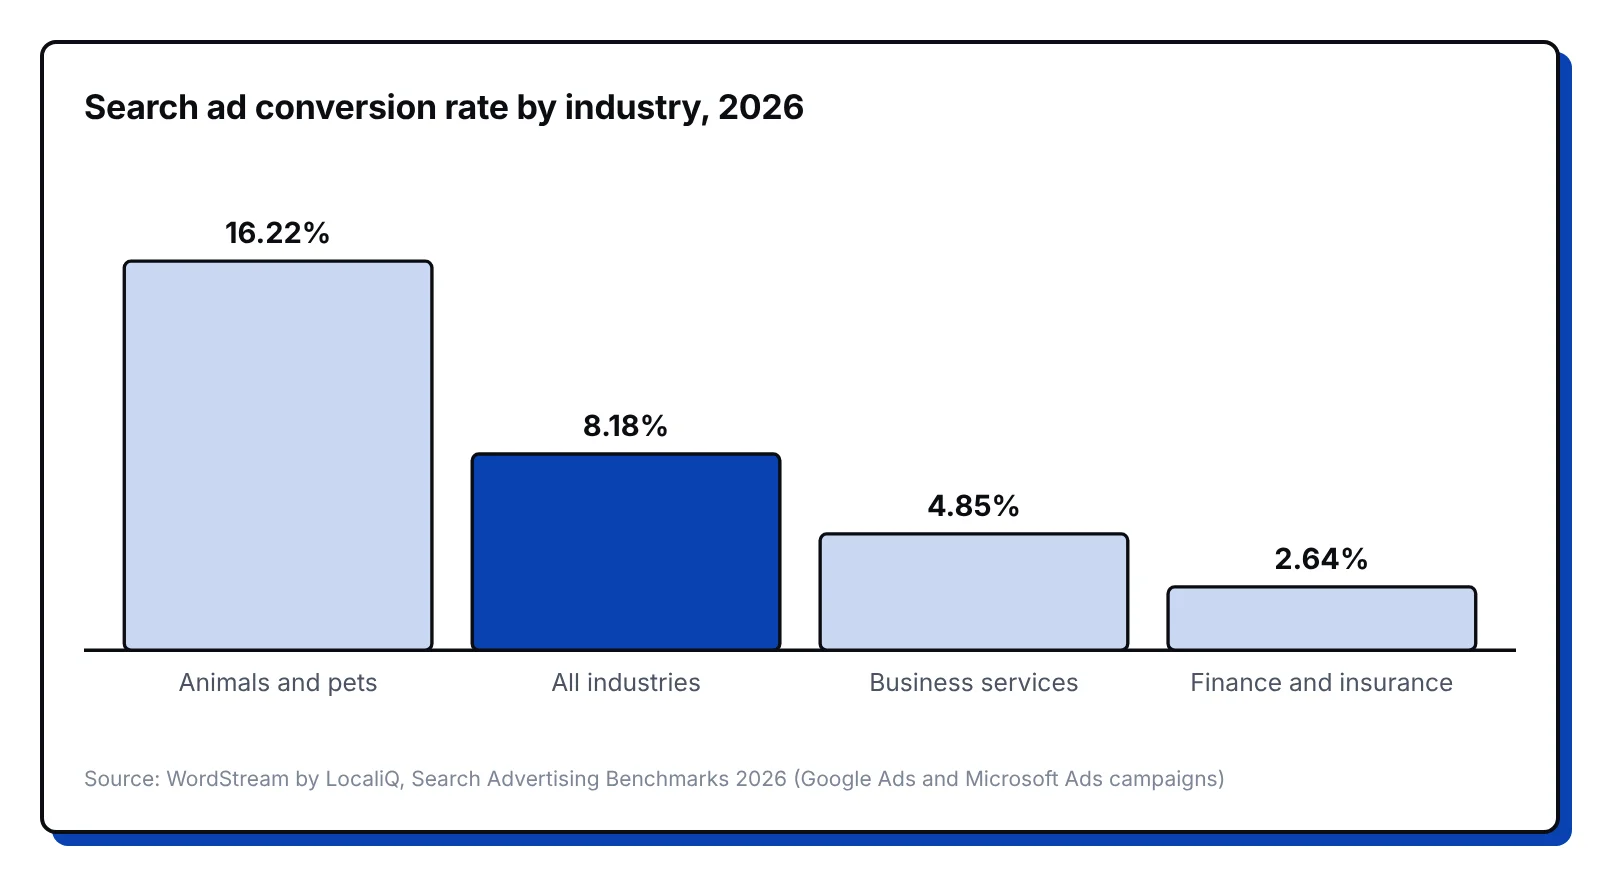
- Search ads convert 8.18% of clicks at a $66.69 average cost per lead, and business services convert 4.85% (WordStream by LocaliQ).
- AI referrals convert above organic search in most studies, yet AI assistants still send under 1% of website visits (Ahrefs).
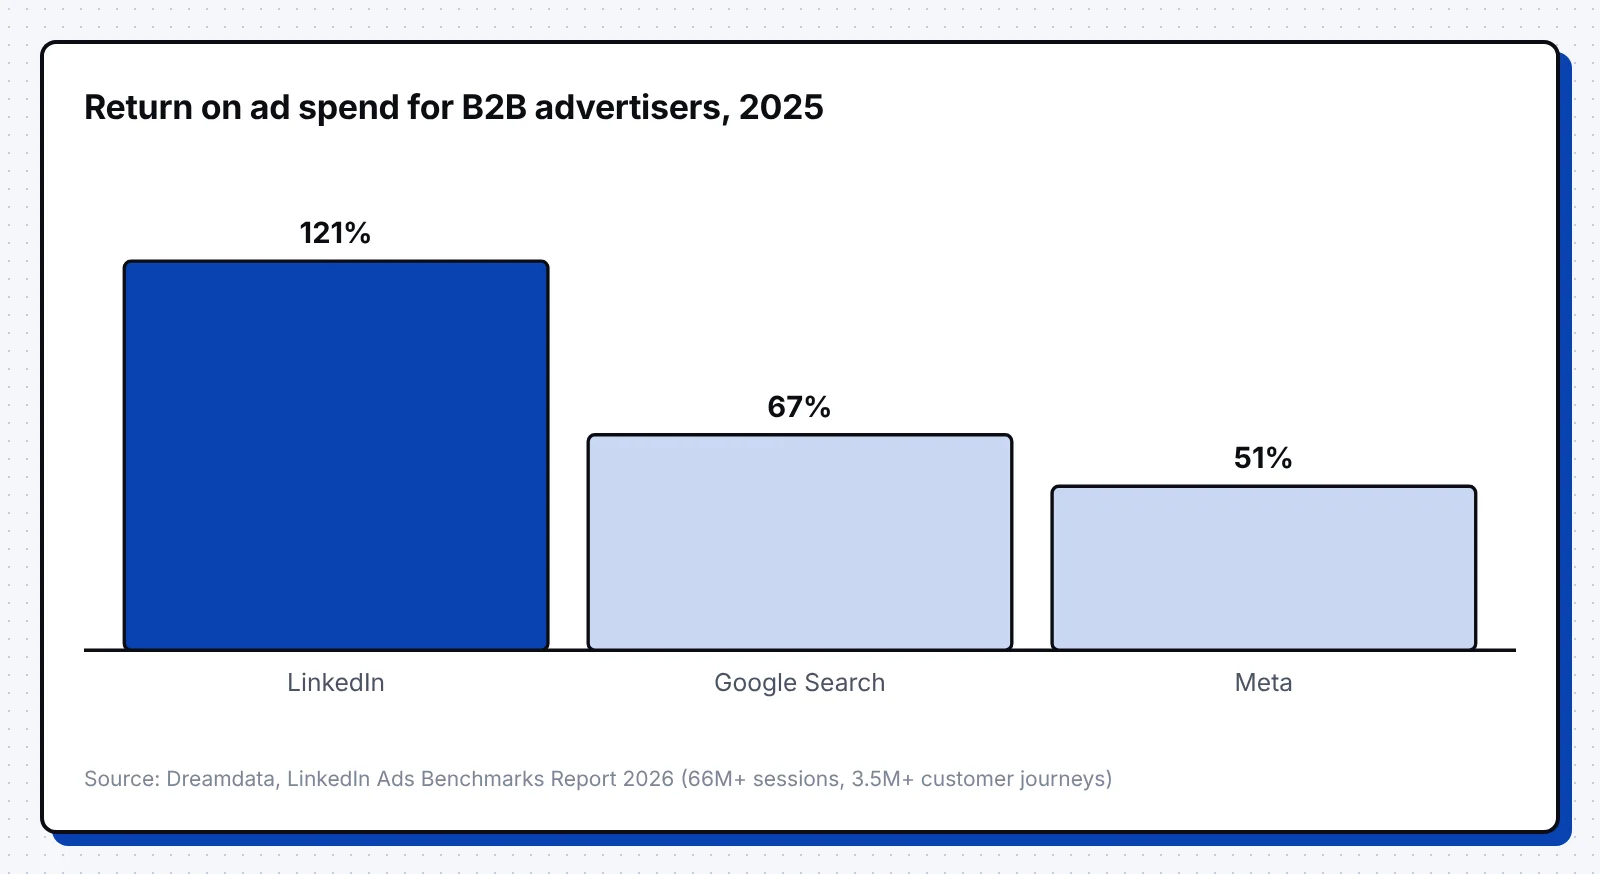
- LinkedIn returned 121% on B2B ad spend in 2025, compared with 67% for Google Search and 51% for Meta (Dreamdata).
How Channel Conversion Rates Are Measured (and Why Sources Differ)
A channel conversion rate divides the conversions from one source by the visits from that source. Studies pick different conversions, visits and attribution models, so paid social shows 2.11% in one report and 12% in another.
Landing page studies count only the visitors who reach a campaign page, which lifts their rates. Site-wide studies count every session, including people who came to read a blog post or log in to the product.
- 5.13% of sessions turned into a qualified lead or sale across 13 industries, measured with multi-touch attribution over 110 million sessions and 5 million conversions. (Ruler Analytics)
- 6.6% is the median landing page conversion rate across 41,000 landing pages, 464 million visitors and 57 million conversions. (Unbounce)
- 19.03% of visits across 118,671 sites had no known channel in October 2026, and the channel groups overlap enough to add up to 104.1%. (Ahrefs)
- 281 days passed on average between a B2B buyer's first LinkedIn ad impression and revenue, and 214 days passed between the first ad conversion and revenue. (Dreamdata)
Conversion Rate by Channel: Overview Table
The table puts each channel's site-wide rate next to a second benchmark from a different kind of study. Use the first column to compare channels with each other and the second to check your campaign pages against platform data.
| Channel | Site-wide rate, qualified lead or sale per session (Ruler Analytics) | Second benchmark |
|---|---|---|
| AI referral | 5.8% | 1.3% of AI-referred sessions (Contentsquare) |
| Paid search | 5.4% | 8.18% of Google Ads search clicks (WordStream by LocaliQ) |
| Organic search | 4.9% | 5.3% of organic ecommerce visits (Similarweb) |
| 4.9% | 19.3% of landing page visitors (Unbounce) | |
| Referral | 4.8% | No second benchmark with a stated method |
| Direct | 4.7% | 0.13% sign-up rate on publisher sites (Microsoft Clarity) |
| Organic social | 2.23% | 0.7% of organic social sessions (Contentsquare) |
| Paid social | 2.11% | 8.54% of Meta lead campaign clicks (WordStream by LocaliQ) |
Organic Search Conversion Rates
Organic search converts close to the all-channel average, and you don't pay for each click. For benchmarks by industry and page type, see our SEO conversion rate guide.
- 4.9% of organic search sessions became a qualified lead or sale, compared with 5.4% for paid search, and software sites converted 7.9% of organic visits. (Ruler Analytics)
- 9% less organic search traffic reached websites year over year, while bounce rates for organic search visitors fell by 4%. (Contentsquare)
- 30.2% of B2B marketers rank their website, blog and SEO among their top three channels for ROI, ahead of email at 23.6% and paid social at 23.3%. (HubSpot)
- About 13% higher conversion for organic search than for ChatGPT referrals across 973 ecommerce sites, while affiliate links were 86% more likely to convert than ChatGPT. (Digiday)
Thankfully, the organic visitors who still click tend to stay, as falling bounce rates show. Our SEO vs PPC statistics compare the two search channels on cost per lead, payback and click share.
Paid Search Conversion Rates
Paid search converts well because people type what they want and land on a page that matches. You pay for every click, so your cost per lead matters as much as the conversion rate.
- 8.18% of Google Ads search clicks converted on average in 2026, at a $5.42 cost per click and a $66.69 cost per lead. (WordStream by LocaliQ)
- 16.22% was the highest search ad conversion rate by industry, in animals and pets, while finance and insurance had the lowest at 2.64%. (WordStream by LocaliQ)
- 4.85% of business services search ad clicks converted, at a $93.69 cost per lead against the $66.69 average. (WordStream by LocaliQ)
- 10.9% of paid search visitors converted on landing pages, and Google search ads converted 11.3%, which is 41% better than Bing. (Unbounce)
- 2.8% of paid search sessions converted across more than 6,000 tracked sites, the highest rate of any paid channel. (Contentsquare)
Email Conversion Rates
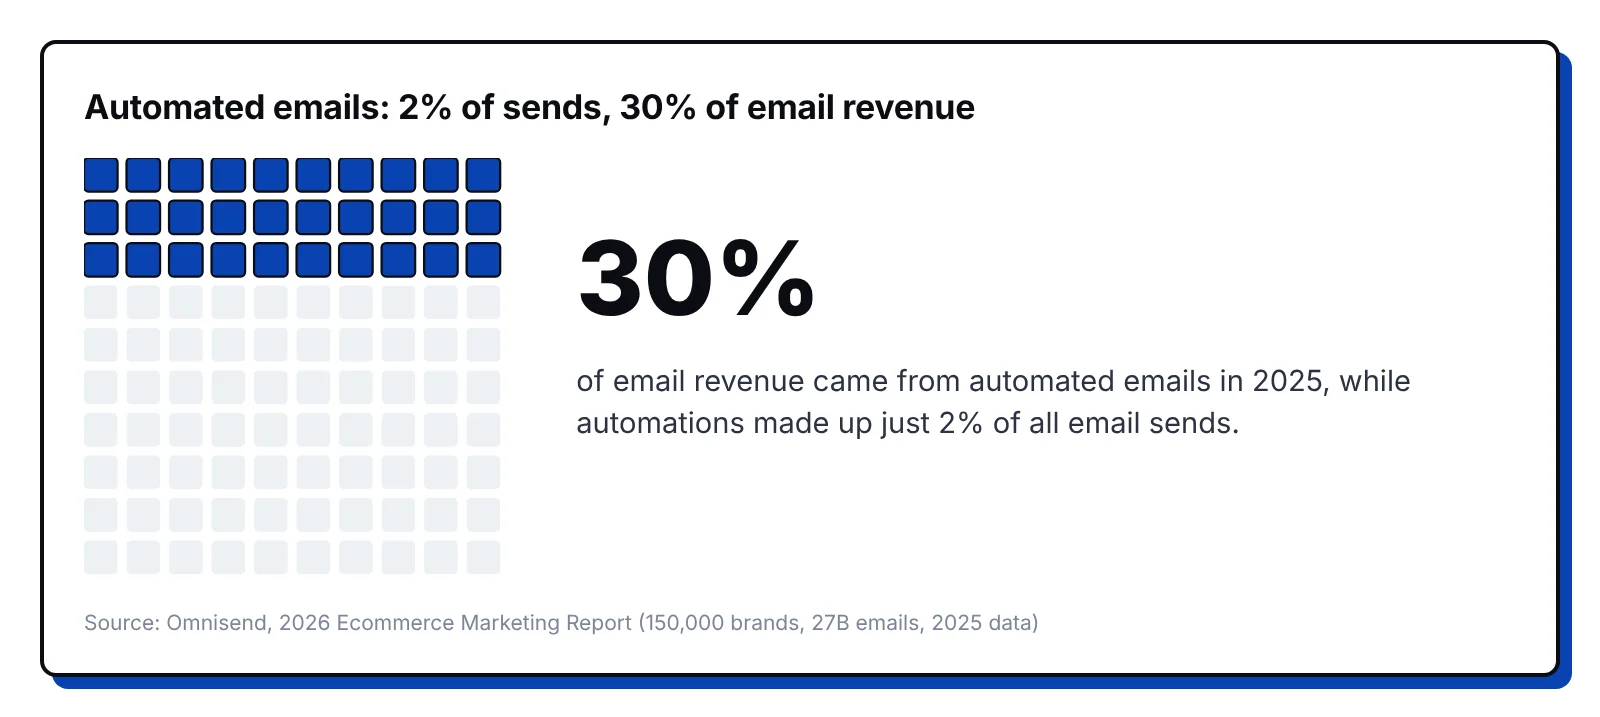
Email reaches people who already know you, so it sends the best converting traffic to landing pages. Automated emails sent after an action, such as a sign-up or an abandoned cart, convert far better than scheduled campaigns.
- 19.3% of email visitors converted on landing pages, 60% more than paid social, 77% more than paid search and 370% more than display ads. (Unbounce)
- 4.9% of email sessions became a qualified lead or sale, rising to 8.5% in education and 7.6% in health and social care. (Ruler Analytics)
- 1.69% average click rate for email campaigns, compared with 5.58% for automated flows, across more than 183,000 Klaviyo customers. (Klaviyo)
- 13 times higher placed order rate for automated flows than for campaigns, with revenue per recipient nearly 18 times higher. (Klaviyo)
- 2% of email sends were automations, yet they brought in 30% of email revenue across 150,000 brands and 27 billion emails in 2025. (Omnisend)
- 19 times higher conversion for automated emails than for campaigns, and email click-to-conversion rose from 5.9% to 9% in 2025. (Omnisend)
Luckily, automated flows are the simplest place to start, since a welcome or demo follow-up email keeps running once you set it up.
Social Media Conversion Rates: LinkedIn, Meta and Organic Social
Social visits convert lowest on most websites, while lead forms inside the platform convert far better. LinkedIn returns the most for B2B advertisers. Our guide to B2B content distribution channels shows how to plan organic posts around it.
- 8.54% average conversion rate for Meta lead campaigns in 2026, at a $1.80 cost per click and a $27.39 cost per lead. (WordStream by LocaliQ)
- 15.87% of Meta lead campaign clicks converted in education and instruction, the top industry, compared with 4.50% in industrial and commercial. (WordStream by LocaliQ)
- 13% average conversion rate for LinkedIn Lead Gen Forms, compared with 4.02% for the average landing page in LinkedIn's comparison. (LinkedIn)
- 121% return on ad spend from LinkedIn for B2B advertisers in 2025, up from 113%, compared with 67% for Google Search and 51% for Meta. (Dreamdata)
- 41% of B2B ad budgets go to LinkedIn, where a click costs €5.98 on average, compared with €1.60 on Meta. (Dreamdata)
- 17.9% of closed B2B deals included an organic LinkedIn company page impression, compared with 9.4% of MQLs and 15% of SQLs. (Dreamdata)
- 28.5% of B2C marketers rank paid social among their top three channels for ROI, the highest share of any channel, with organic social at 23.9%. (HubSpot)
Referral and Direct Traffic Conversion Rates
Referral and direct visitors often know your brand already, so both convert close to the site-wide average. Direct also collects the visits that analytics can't trace to a source, which makes it a mixed bucket.
- 4.8% of referral sessions and 4.7% of direct sessions became a qualified lead or sale, and automotive sites converted 9.8% of direct visits. (Ruler Analytics)
- 2.9% of returning visitors converted, compared with 1.7% of new visitors, and returning visits made up 52.8% of traffic. (Contentsquare)
AI Search Referral Conversion Rates: ChatGPT, Perplexity and Gemini
AI assistants send a small share of visits, and most studies find those visitors convert above organic search. Ecommerce results vary more, so track AI referrals as their own channel before you judge them. Our AI SEO statistics cover AI citations and traffic in more depth.
- 5.8% of AI referral sessions became a qualified lead or sale, the highest rate of any channel, and software sites converted 7.9% of them. (Ruler Analytics)
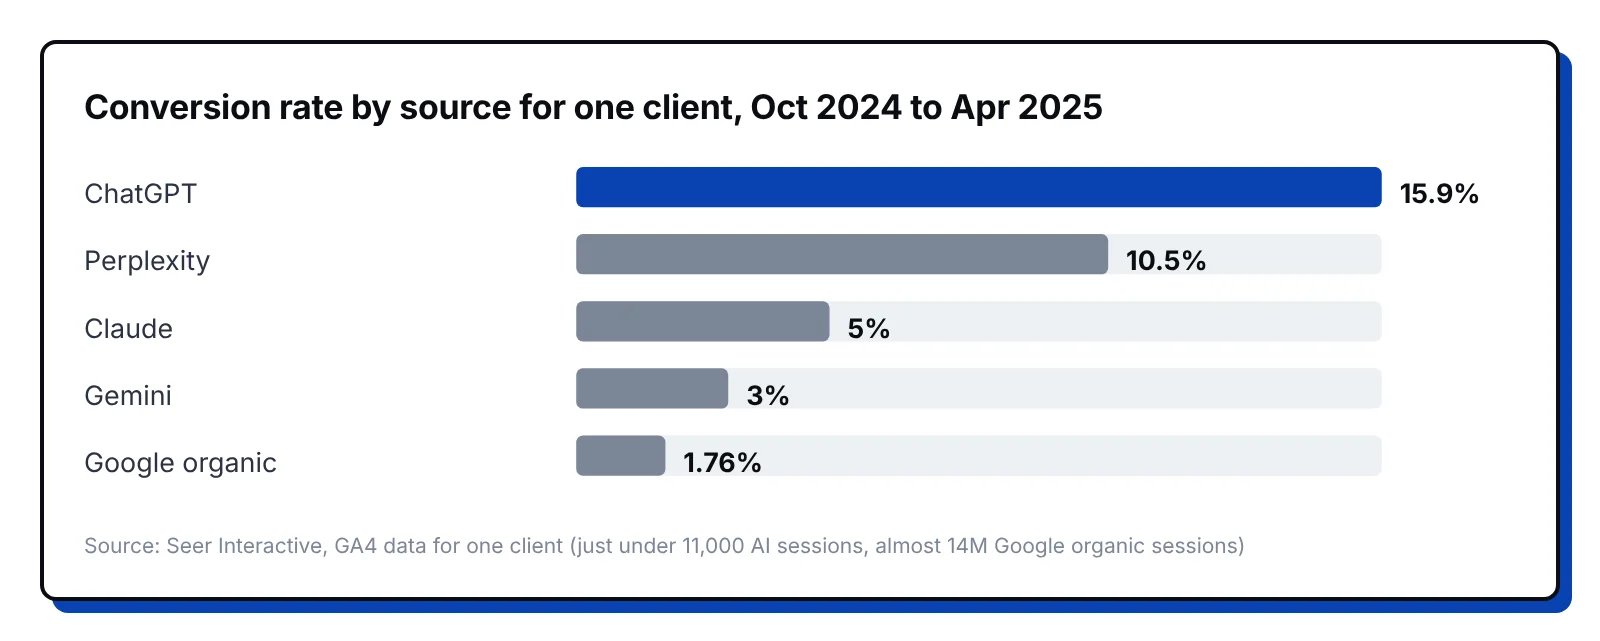
- 15.9% of ChatGPT visitors converted for one client, compared with 1.76% of Google organic visitors, between October 2024 and April 2025. (Seer Interactive)
- 10.5% of Perplexity visitors converted for the same client, against 5% of visitors from Claude and 3% from Gemini. (Seer Interactive)
- 23 times higher conversion rate for AI search visitors than for organic search visitors on ahrefs.com over 30 days in 2025. (Ahrefs)
- 0.5% of visits to ahrefs.com came from AI search over the same 30 days, while those visits produced 12.1% of signups. (Ahrefs)
- 4.4 times as valuable is the average AI search visitor compared with an organic search visitor, based on conversion rate across 500+ marketing topics. (Semrush)
- 11.4% of ChatGPT-referred ecommerce visits converted, compared with 5.3% of organic search visits, from July 2024 to June 2025. (Similarweb)
- 1.1 billion referral visits came from AI platforms in June 2025, up 357% year over year, and AI referrals to transactional sites converted at about 7%. (Similarweb)
- 1.66% of AI visitors signed up on publisher and news sites, compared with 0.46% from social, 0.15% from search and 0.13% from direct. (Microsoft Clarity)
- 1.34% of AI visitors subscribed, against 0.55% of search visitors, and Copilot referrals subscribed at 17 times the rate of direct traffic. (Microsoft Clarity)
- 1.3% of AI-referred sessions converted, up 55% in a year and the only channel to grow its rate, just above organic social at 0.7%. (Contentsquare)
- 92.4% of 6.77 million LLM sessions across 166 GA4 properties came from ChatGPT, and Claude passed Perplexity in monthly sessions in March 2026. (Previsible)
- 61.5% of marketers find leads from AI research better informed and 57.9% see higher intent, though 55% say these leads reach sales later. (HubSpot)
- 94% of business buyers use AI during their buying process, up from 89% a year earlier. (Forrester)

Interestingly, sign-up studies show the widest gaps, while ecommerce studies range from ChatGPT doubling the organic rate to trailing it by about 13%. Treat any single multiple as one site's result until your own data agrees.
B2B vs B2C Conversion Rates by Channel
B2B pages often ask for a demo or a sales call, a bigger step than a B2C purchase or sign-up. Search and email hold up well for B2B, while paid social converts much better for B2C. Our B2B conversion rate benchmarks go deeper by industry.
- 2.6% of B2B visitors from thought leadership SEO became leads, compared with 2.1% for B2C, while paid social converted 0.9% for B2B and 2.1% for B2C. (First Page Sage)
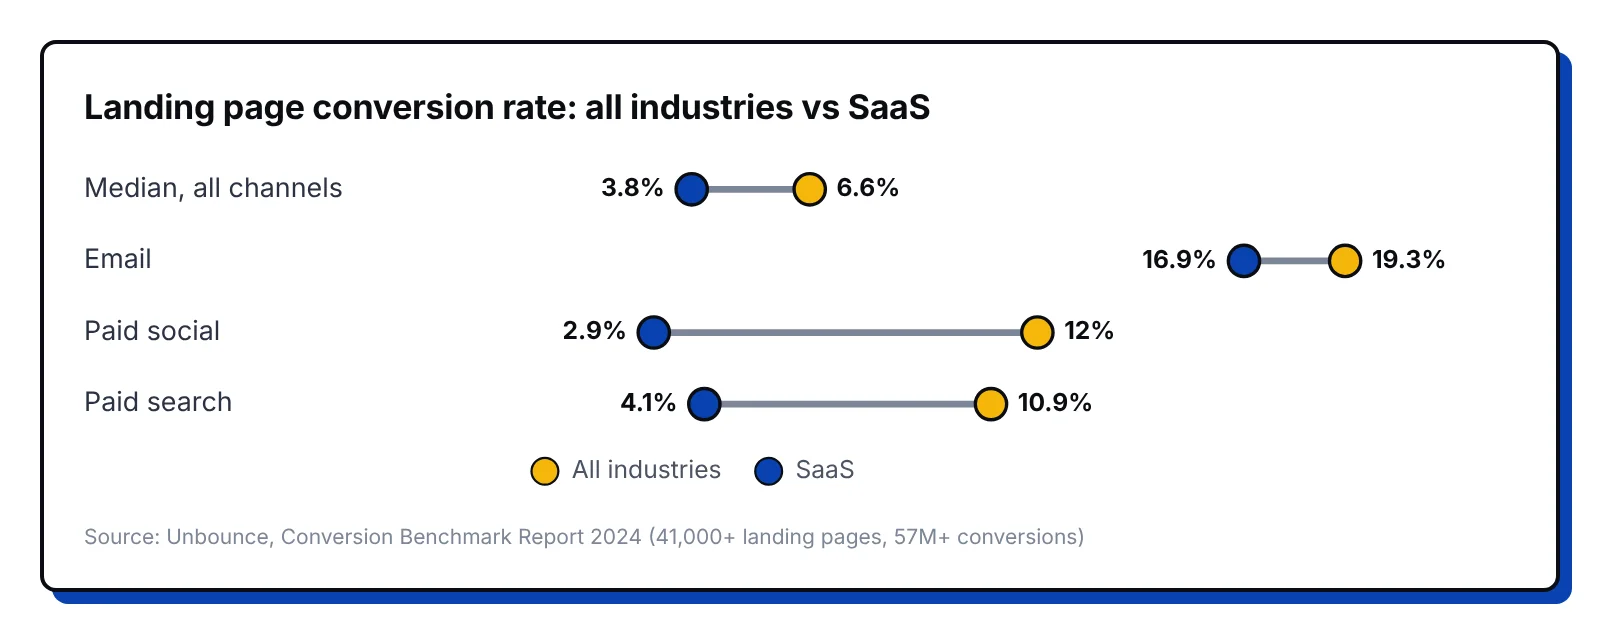
- 3.8% is the median conversion rate for SaaS landing pages, 42% lower than the 6.6% median across all industries. (Unbounce)
- 16.9% of email visitors converted on SaaS landing pages, compared with 4.1% from paid search, 2.9% from paid social and 0.3% from display ads. (Unbounce)
- 48.4% of B2B marketers name their website, blog and SEO as a top channel, while B2C marketers lean most on organic social at 41.7%. (HubSpot)
- 2.66% of organic search sessions converted on financial services sites, compared with 1.83% of paid search sessions. (Contentsquare)
Channel Conversion Rates Further Down the Funnel
A channel that fills forms can still lose deals later, so compare lead-to-customer rates by source before you move budget. Few studies publish full funnels by channel, so use these as starting points for your own CRM report.
- 51% of B2B SaaS MQLs from SEO became SQLs, compared with 26% from PPC, and 49% of SEO SQLs became opportunities against 38% from PPC. (First Page Sage)
- 62% of qualified inbound leads booked a meeting at the median B2B SaaS company, while the top 10% booked 78% or more. (RevenueHero)
- 71.2% of enterprise inbound leads were disqualified before a meeting, compared with 28.1% at mid-market and 21.8% at SMB companies. (RevenueHero)
- 30.2% of the sessions behind B2B SQLs came from LinkedIn, compared with 24.2% behind MQLs and 28.3% behind new business. (Dreamdata)
- €70.11 was the cost per company influenced on LinkedIn, down from €154, compared with €110.37 on Google Search and €128.70 on Meta. (Dreamdata)
Fortunately, your CRM already holds the data to build this view. Tag every lead with its first and last source, then report opportunities and closed deals by both.
How to Use These Benchmarks
Benchmarks help most when the study's method matches your own tracking. Use these steps to compare your channels on equal terms.
- Pick one conversion, such as a demo request or a qualified lead, and report every channel against that same event.
- Compare site-wide rates with Ruler Analytics and campaign landing pages with Unbounce, since each study counts visits in its own way.
- Create an AI referral channel group in GA4 for ChatGPT, Perplexity, Gemini, Claude and Copilot so those visits stop landing in referral or direct.
- Add lead-to-opportunity and opportunity-to-close rates by source from your CRM, because a strong form rate can hide a weak pipeline.
- Review the numbers each quarter and move budget toward the channels with the lowest cost per opportunity.
If you'd like help building that report, our B2B SEO agency team sets up channel tracking and writes content that turns search and AI visitors into pipeline.
How We Picked These Sources
We used studies published from 2024 to 2026 that state their sample, data period and conversion definition, and we opened every source to confirm each number. Older data appears only where nothing newer exists, and the link title shows its year.
We capped each publisher at six numbers so no single dataset sets the picture. We also left out roundup sites that repeat figures without the original study, and we name the sample behind every link.
FAQ
What is a good conversion rate by channel?
A site-wide rate above 5.13% beats the average in Ruler Analytics' 2026 data, which counts a qualified lead or sale per session. Paid search averages 5.4%, organic search and email 4.9%, and organic and paid social about 2.2%.
Which marketing channel has the highest conversion rate?
Email converts best on landing pages, at 19.3% of visitors in Unbounce's data. Across whole websites, AI referrals lead at 5.8% and paid search follows at 5.4% (Ruler Analytics).
Does AI search traffic convert better than organic search?
In most studies, yes. Seer Interactive measured 15.9% for ChatGPT visitors against 1.76% for Google organic, and Similarweb estimates 11.4% against 5.3% for ecommerce. A study of 973 ecommerce sites by Kaiser and Schulze found organic search converting about 13% better than ChatGPT, so test it on your own site.
What is the average conversion rate for paid social?
Paid social turns 2.11% of sessions into a qualified lead or sale site-wide (Ruler Analytics). Meta lead campaigns convert 8.54% of clicks (WordStream by LocaliQ), and LinkedIn Lead Gen Forms average 13%.
Why do conversion rate benchmarks differ so much between studies?
Each study counts a different visit and a different conversion. Landing page studies count only campaign visitors, ad platforms count clicks, and site-wide studies count every session against a qualified lead or sale.
How do B2B and B2C conversion rates differ by channel?
SaaS landing pages convert at a 3.8% median, against 6.6% across all industries (Unbounce). Email still leads for SaaS at 16.9%, while paid social drops to 2.9%.
To keep learning, read our SEO conversion rate benchmarks, our B2B conversion rate guide and our SEO vs PPC statistics.