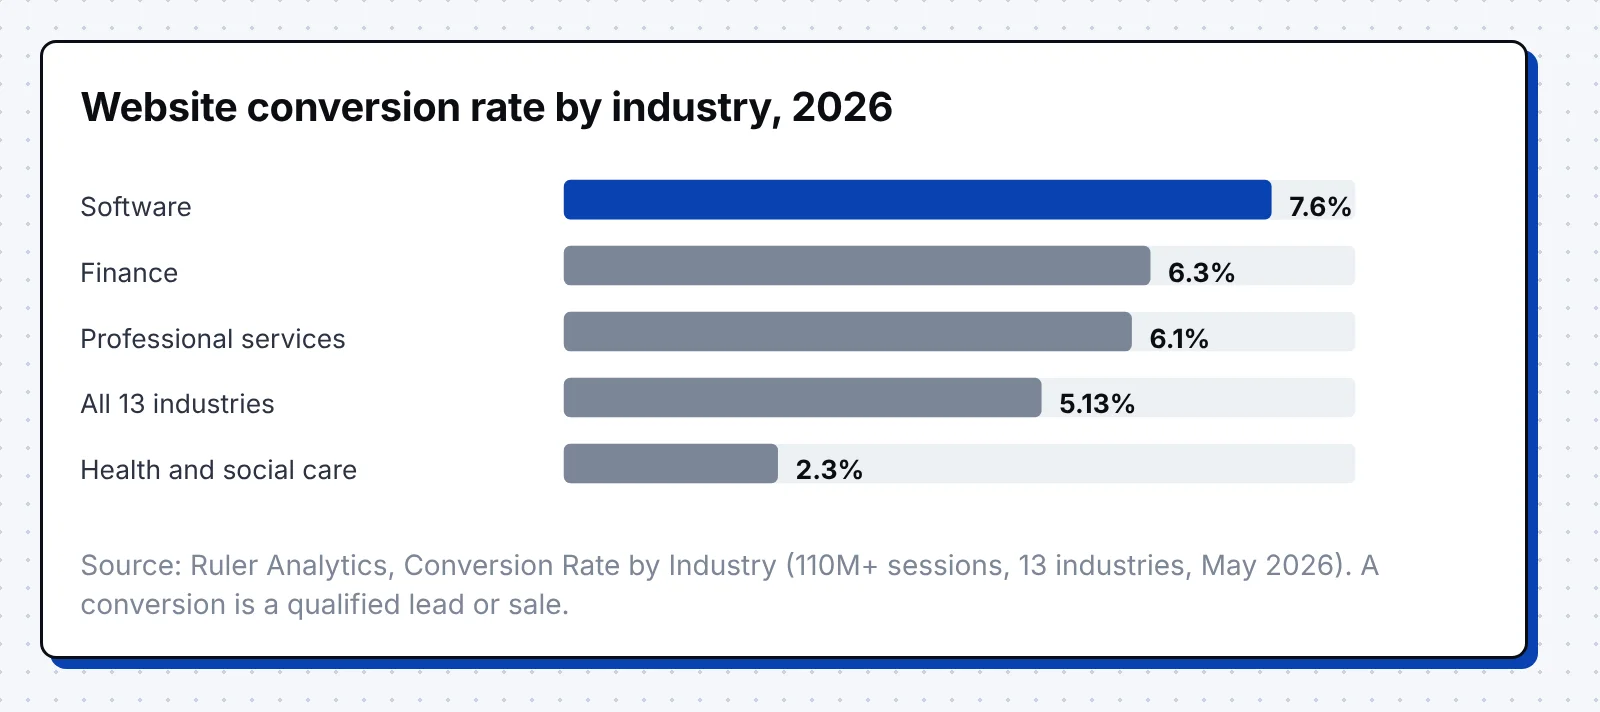
The average website turns 5.13% of its sessions into a qualified lead or sale, across 13 industries and more than 110 million sessions tracked in 2026 (Ruler Analytics). Software websites convert 7.6%, the highest rate of any B2B sector in the study.
That average hides wide gaps between industries, channels and funnel steps, since landing pages, search ads, demo forms and free trials each convert at their own rate. Every number below links to its original study, with the sample and date in the link, so you can compare each step of your funnel with the right benchmark.
Key takeaways
- Websites convert 5.13% of sessions into qualified leads or sales on average, and software websites convert 7.6% (Ruler Analytics).
- SaaS landing pages convert at a 3.8% median, which is 42% lower than the 6.6% median across all industries (Unbounce).
- The median B2B SaaS company books 62% of qualified demo requests, while the top 10% book 78% or more (RevenueHero).
- Free trials that require a credit card convert 30% of users to paid, against an 8% median across all free-to-paid models (ChartMogul).
- Median win rates fall from 31% on deals under $10K to 15% on deals above $100K, and buying cycles average about 10 months (Optifai, 6sense).
What Counts as a B2B Conversion
A B2B conversion is any action that turns an anonymous visitor into a known contact or moves that contact closer to a sale. Most studies count a form fill, a call or a signup, though some count only the leads that sales accepts.
- A demo or contact request is the main conversion for sales-led B2B companies with a sales team.
- A free trial or freemium signup is the main conversion for product-led software companies.
- A phone call from the website matters most in professional services and other sectors where buyers prefer to talk first.
- A content download or webinar signup creates a lead that still needs qualifying before sales gets involved.
- A booked meeting is the conversion some teams track instead of the form fill, since it shows real buying intent.
Decide which of these actions your team counts, then track each one as a separate key event, as in our guide to B2B website metrics. A study that counts every form fill will always show a higher rate than one that counts only qualified leads.
Average B2B Website Conversion Rate
Average conversion rates run from about 2% to 8%, depending on what each study counts as a conversion and what it divides by. Session studies, landing page studies and search ad studies each give a different average for the same websites.
- 5.13% of website sessions turned into a qualified lead or sale on average in 2026, across 13 industries and more than 110 million sessions. (Ruler Analytics)
- 6.6% is the median landing page conversion rate across all industries, based on more than 41,000 landing pages and 57 million conversions. (Unbounce)
- 8.18% of Google and Microsoft search ad clicks turned into leads in 2026, at an average cost per lead of $66.69. (WordStream by LocaliQ)
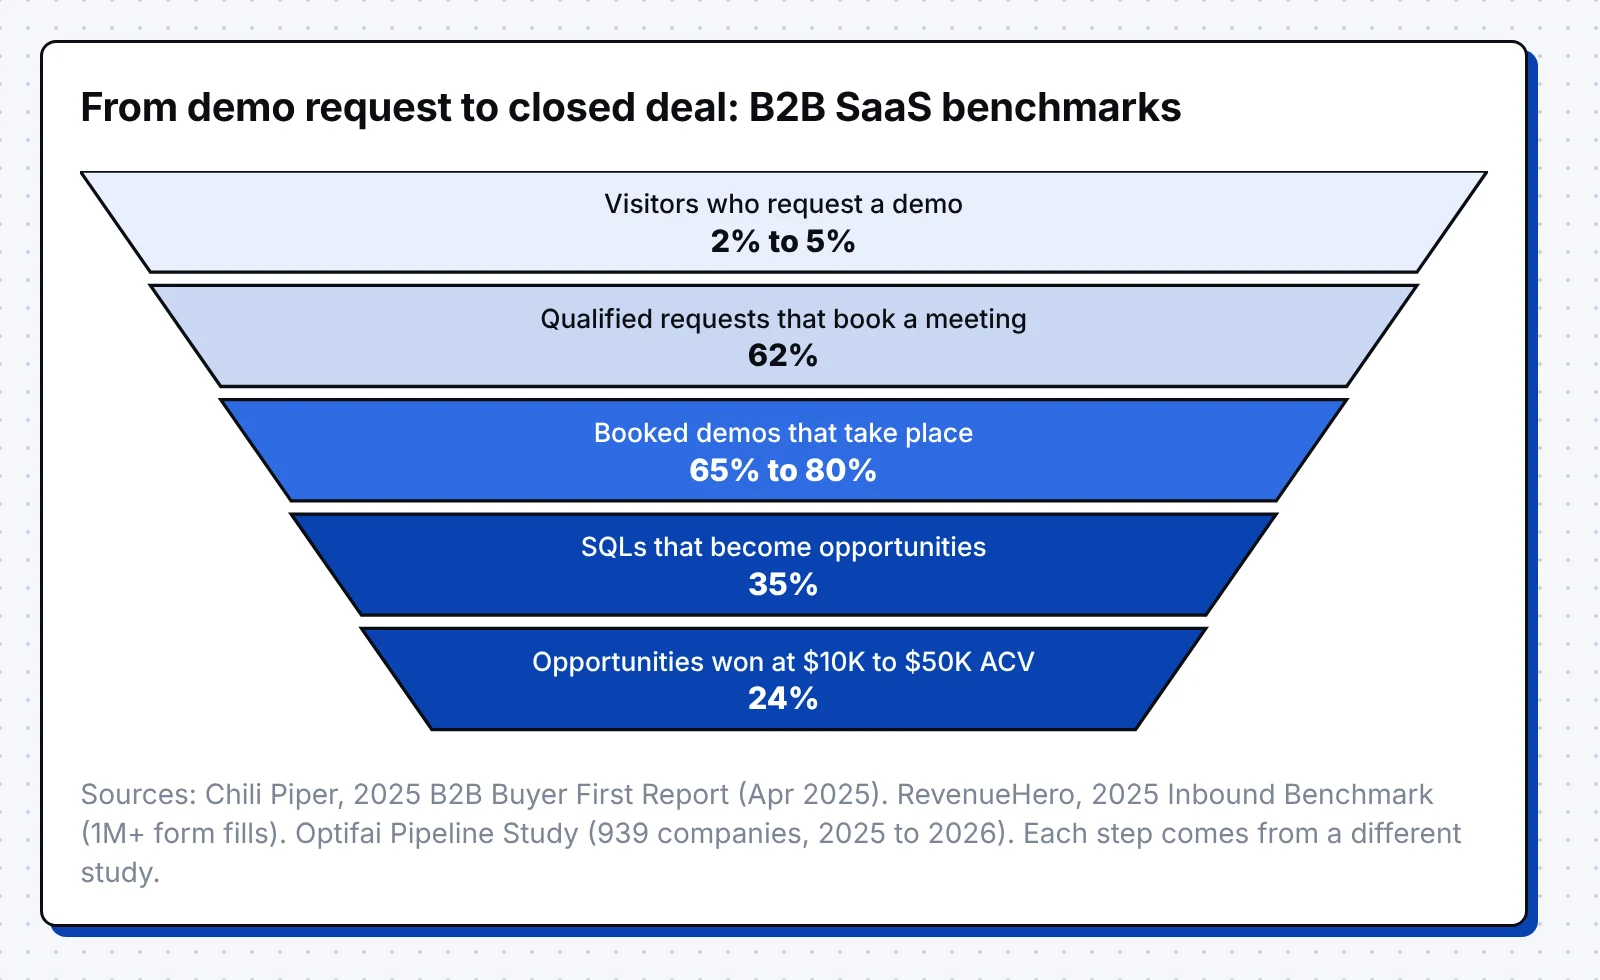
- 2% to 5% of B2B SaaS website visitors request a demo, while free trial pages convert 2% to 15% of visitors and freemium pages 3% to 20%. (Chili Piper)
B2B Conversion Rates by Industry
Industry moves the average more than any other factor except channel. Software and financial websites convert well above the cross-industry average, while healthcare sits near the bottom in session data and near the top for search ads.
SaaS and Software
- 7.6% of software website sessions converted in 2026, with paid search at 8.2% and both organic search and AI referrals at 7.9%. (Ruler Analytics)
- 3.8% is the median SaaS landing page conversion rate, 42% below the all-industry median, with hardware pages at 4.1% and data and infrastructure pages at 3.3%. (Unbounce)
Professional Services
- 6.1% of professional services website sessions converted in 2026, and organic search led every channel in the sector at 8.1%. (Ruler Analytics)
- 6.1% is the median landing page conversion rate for commercial and professional services, and email traffic to those pages converts at 13.9%. (Unbounce)
- 4.85% of business services search ad clicks became leads in 2026, at an average cost per lead of $93.69. (WordStream by LocaliQ)
Manufacturing, Industrial and IT
- 2.2% of manufacturing website visitors become leads, compared with 1.5% for IT and managed services, 1.9% for financial services and 1.1% for B2B SaaS. (First Page Sage)
- 8.20% of industrial and commercial search ad clicks became leads in 2026, at an average cost per lead of $75.19. (WordStream by LocaliQ)
Financial Services
- 6.3% of finance website sessions converted in 2026, and email was the strongest channel in the sector at 7.1%. (Ruler Analytics)
- 8.3% is the median landing page conversion rate in financial services, led by insurance at 18.2%, with credit and lending at 8.8% and investing at 3.9%. (Unbounce)
- 2.64% of finance and insurance search ad clicks became leads in 2026, at an average cost per lead of $74.44. (WordStream by LocaliQ)
Healthcare
- 2.3% of health and social care website sessions converted in 2026, less than half the cross-industry average, though email converted at 7.6%. (Ruler Analytics)
- 5.1% is the median landing page conversion rate in health and wellness, with medical treatment pages at 5.3% and dental pages at 4.3%. (Unbounce)
- 12.43% of search ad clicks for physicians and surgeons became leads in 2026, at an average cost per lead of $40.04. (WordStream by LocaliQ)
B2B Conversion Rates by Channel
AI referrals and paid search convert best in 2026 session data, while social traffic converts at less than half the average. We break each channel down by industry in conversion rate by channel.
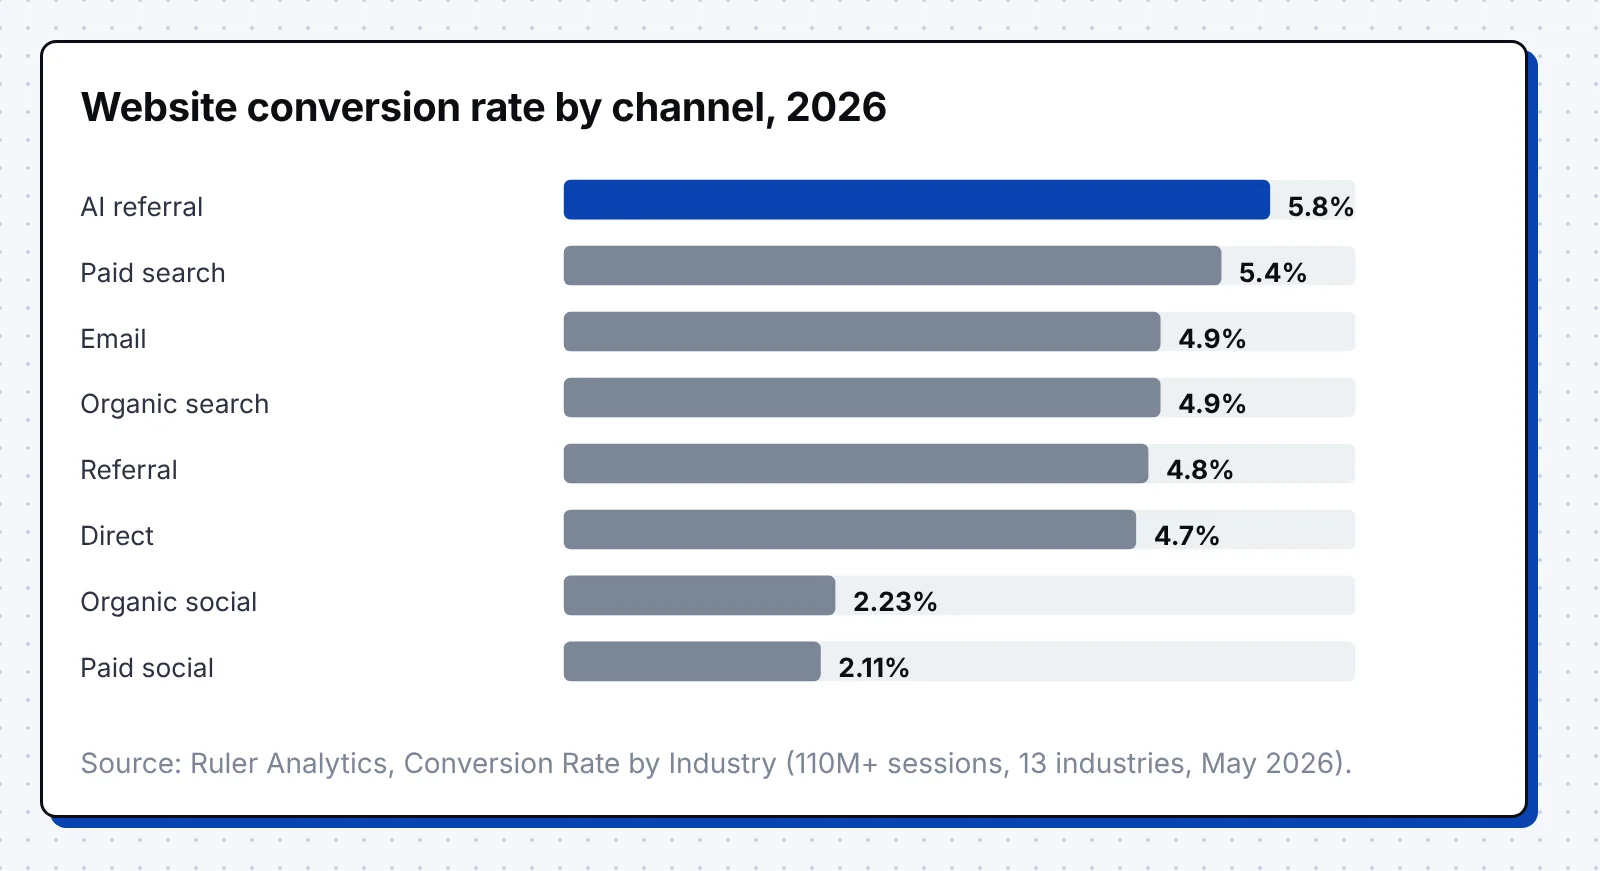
- 5.8% of AI referral sessions converted in 2026, the highest of any channel, ahead of paid search at 5.4%. Email and organic search converted at 4.9%, referral at 4.8%, direct at 4.7%, organic social at 2.23% and paid social at 2.11%. (Ruler Analytics)
- 13% is the average conversion rate of LinkedIn Lead Gen Forms, compared with 4.02% for the average landing page. (LinkedIn)
- 121% return on ad spend came from LinkedIn Ads in 2025, against 67% for Google Search and 51% for Meta, measured on closed-won revenue. (Dreamdata)
- 12.1% of Ahrefs signups came from AI search over 30 days, although AI search brought in only 0.5% of visits. (Ahrefs)
- 4.4x as valuable as a traditional organic search visitor is the average AI search visitor, measured by conversion rate. (Semrush)
B2B Funnel Conversion Rates by Stage
Stage rates depend on how your team defines a lead, an MQL and an SQL, so two companies in one industry can report very different numbers. Compare the stages inside your own funnel first, then check each one against the ranges below.
Our demand generation funnel guide explains what happens at each stage, and our lead to MQL conversion rate benchmarks cover the first handoff from marketing in more detail.
- 1.4% of visitors become leads at B2B SaaS companies with $10M to $100M in revenue. From there, 41% of leads become MQLs, 39% of MQLs become SQLs, 42% of SQLs become opportunities and 39% of opportunities close. (First Page Sage)
- 22% of leads become MQLs in a 2024 to 2025 pipeline benchmark from agency campaigns, followed by 15% from MQL to SQL, 11% from SQL to opportunity and 7% from opportunity to closed won. (MarketJoy)
- 35% is the benchmark rate from SQL to opportunity in B2B SaaS, and 65% to 80% of scheduled demos take place. (Chili Piper)
- 14.1% of people who filled out a B2B demo form in 2024 did not qualify, a group that includes spam, personal email addresses and failed qualification rules. (Chili Piper)
- 71.2% of inbound form fills are disqualified at enterprise-focused companies, against 28.1% at mid-market companies and 21.8% at SMB-focused companies. (RevenueHero)
Demo and Free Trial Conversion Rates
Demo and trial rates measure the step where a lead asks to talk to sales or to try the product. Helpfully, response speed and the booking flow sit within your control, and they change these rates as much as lead quality does.
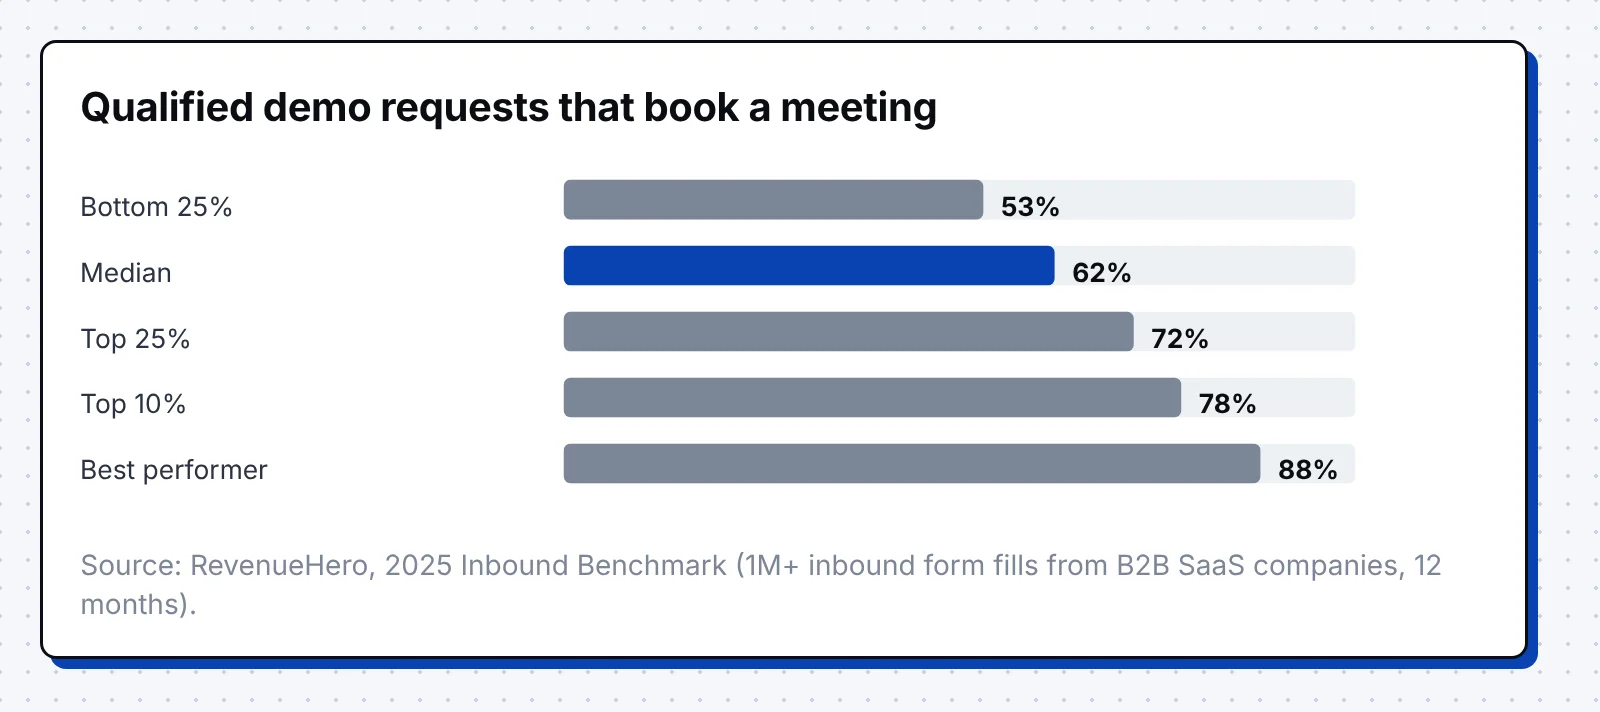
- 62% of qualified inbound demo requests book a meeting at the median B2B SaaS company. The bottom quarter books 53%, the top quarter 72%, the top 10% book 78% and the best performer 88%. (RevenueHero)
- 70.1% of qualified requests book a meeting at enterprise-focused companies, against 61.2% in mid-market and 63.2% at SMB-focused companies. (RevenueHero)
- About 80% of leads book a meeting when they can schedule within the first minute, against about 40% when the follow-up waits until the next business day. (RevenueHero)
- 66.7% of qualified form submissions booked a meeting in 2024 when buyers could schedule on the spot, against an industry average of 30%, and 69.2% when a live call option was added. (Chili Piper)
- 16% of the top 100 B2B SaaS companies never replied to a demo request, while the best performers replied within 8 hours on average. (Chili Piper)
- 8% of free users convert to paying customers within six months at the median, across 200 B2B software products surveyed in January 2026. (ChartMogul)
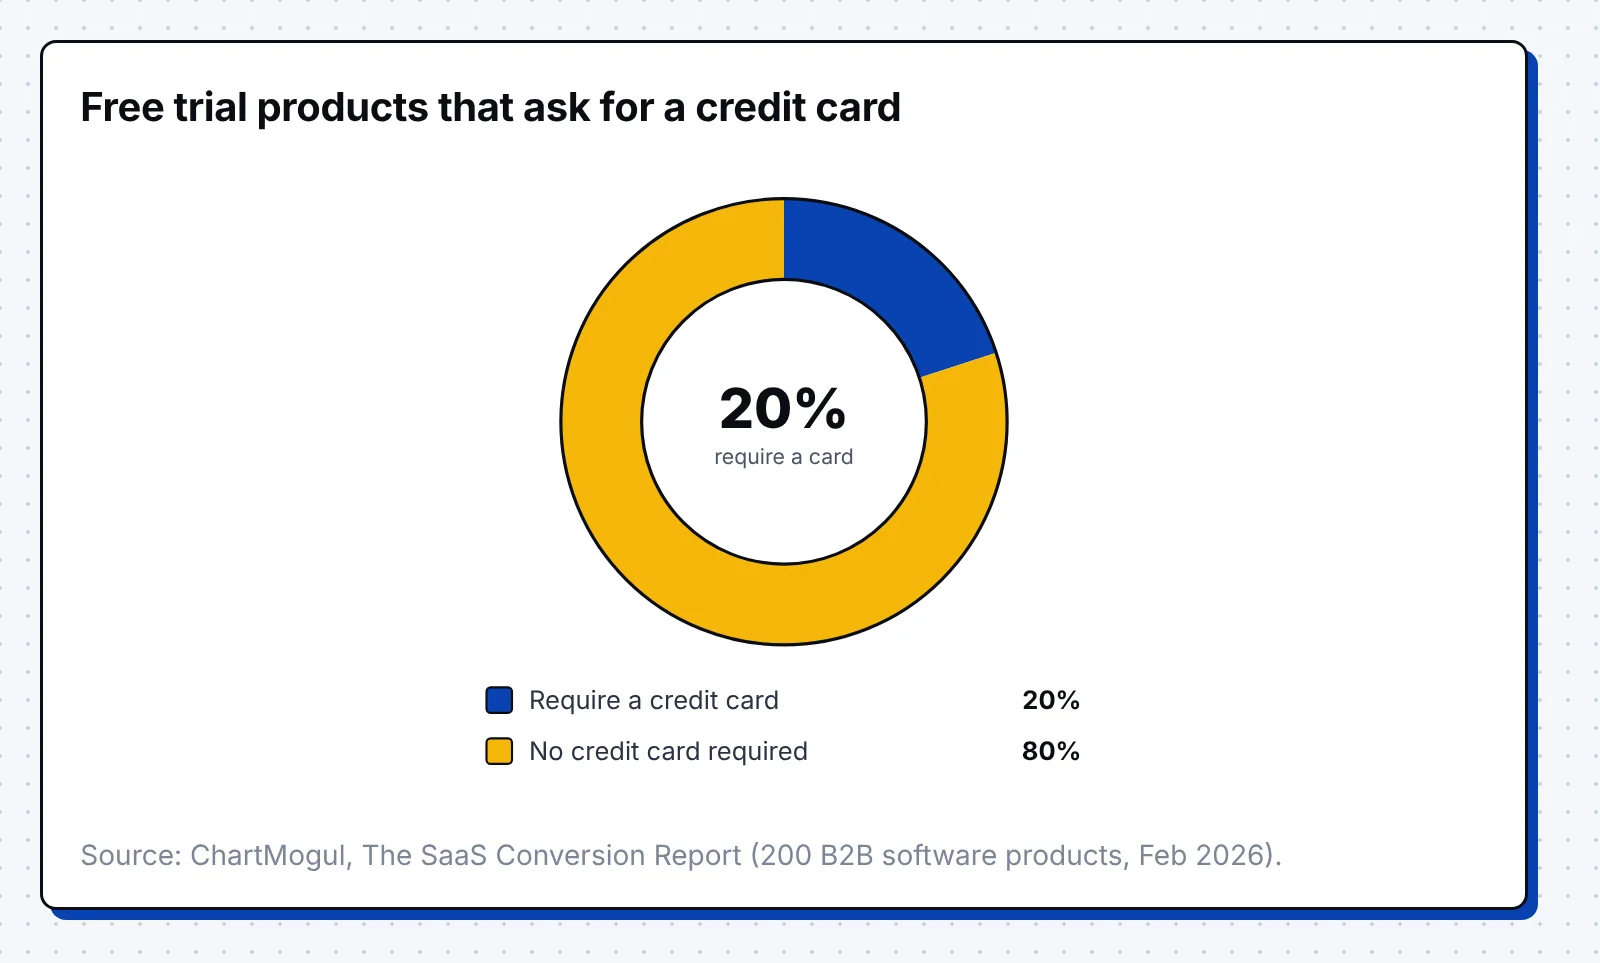
- 30% of free trial users convert to paid when the trial requires a credit card, more than 5x the rate without one, yet only 20% of trial products ask for a card. (ChartMogul)
- 6% to 10% free-to-paid conversion counts as good for B2B products and 15% to 20% counts as great, both higher than for B2C or hybrid products. (ChartMogul)
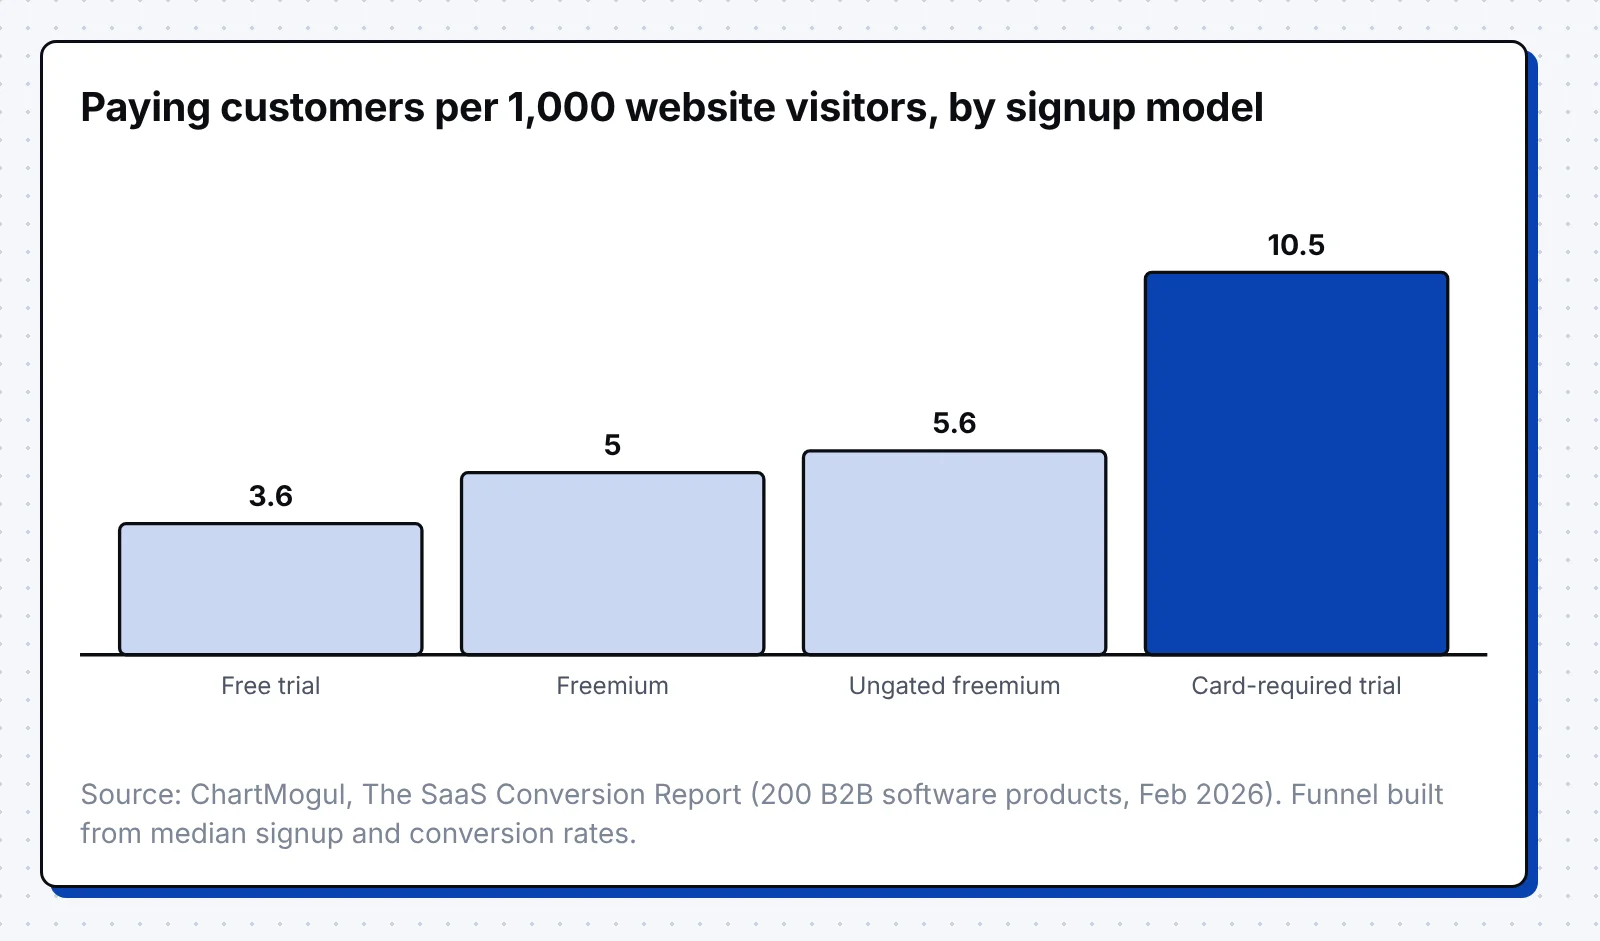
- 10.5 paying customers come from every 1,000 visitors with a card-required trial, against 5.6 for ungated freemium, 5 for freemium and 3.6 for a free trial without a card. (ChartMogul)
- More than 60% of business buyers use a trial before they buy, rising to 78% for purchases of $10 million or more. (Forrester)
Landing Page and Form Conversion Benchmarks
Page and form benchmarks show what lifts the rate on the page itself. Luckily, plain copy, fast pages and a booking step right after the form move these numbers more than the number of form fields.
- 11.1% is the median conversion rate for landing pages written at a 5th to 7th grade reading level, against 5.3% for pages written at a professional level. (Unbounce)
- 3x higher conversion rate for a B2B site that loads in 1 second than for one that loads in 5 seconds, across 14 lead generation sites studied in 2022. (Portent)
- 77% of qualified leads booked a meeting on top performers' 2-field forms, against 76% on their 13-field forms. (RevenueHero)
- 76% of top-performing demo pages show customer logos, 57% show testimonials and 36% show G2 or Capterra badges. (RevenueHero)
- 8% of top B2B SaaS companies let buyers book a meeting straight from the form, and companies that removed a second form step saw conversions rise 50%. (Chili Piper)
B2B Sales Cycle and Win Rate Benchmarks
Win rates and cycle length show what happens after an opportunity opens. Larger deals take longer, involve more people and close less often, so compare your win rate with deals of the same size.
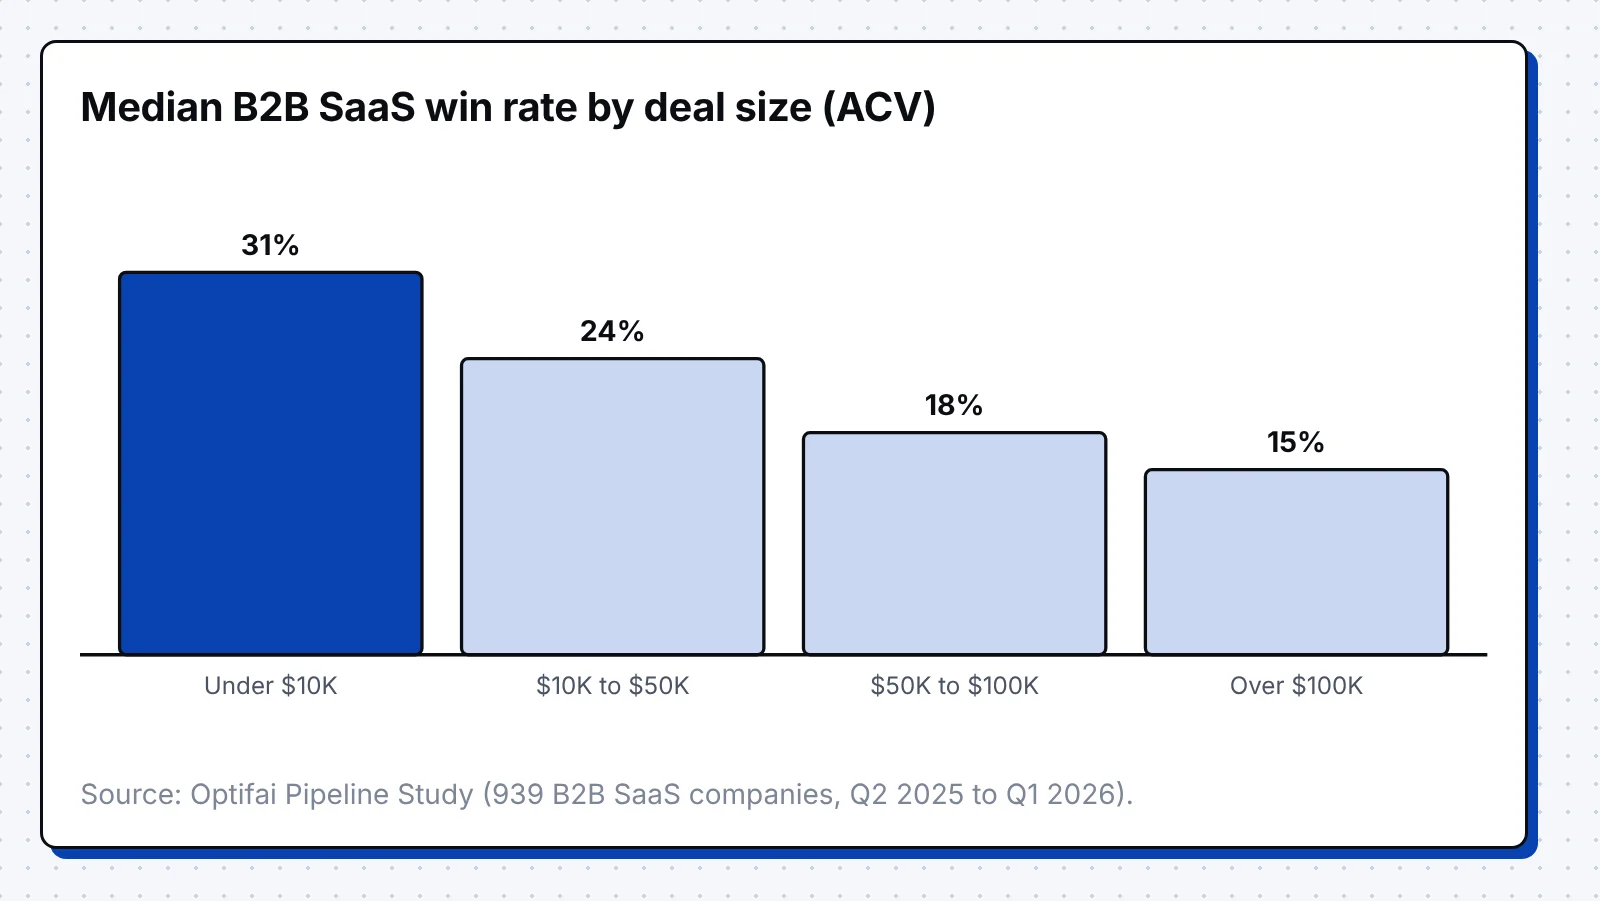
- 31% is the median win rate for B2B SaaS deals under $10K in annual contract value, falling to 24% for $10K to $50K, 18% for $50K to $100K and 15% above $100K. (Optifai)
- 10% is how far win rates fell in 2025, while sales cycles got 9% shorter, across 655,000 opportunities worth $48 billion. (Ebsta)
- 10 months is the average B2B buying cycle in 2025, down from about 11 months in 2024, based on more than 4,000 buyers. (6sense)
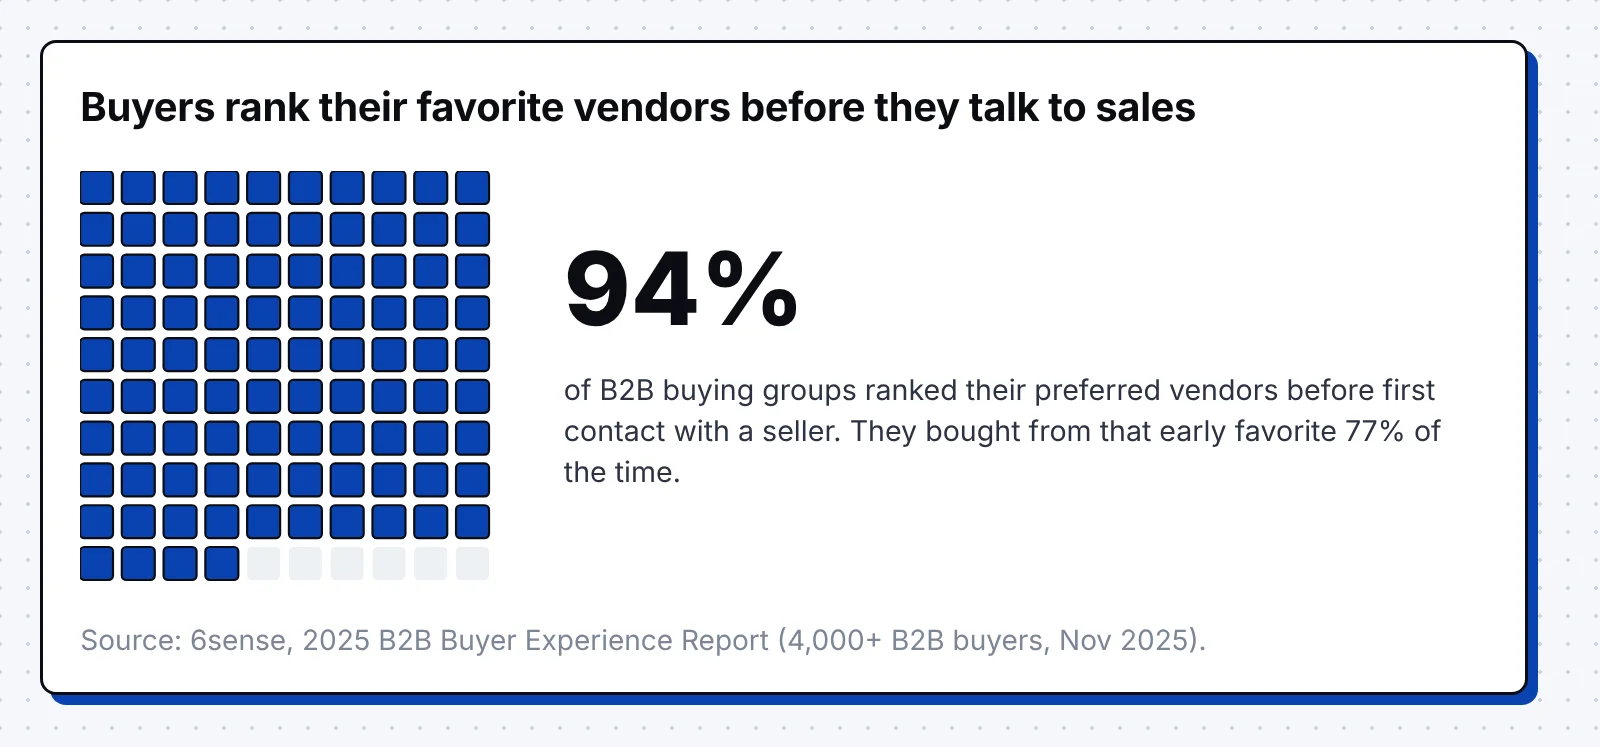
- 94% of buying groups ranked their preferred vendors before first contact with a seller, and 77% bought from that early favorite. (6sense)
- 16 interactions per person with the winning vendor is the average, and buyers now split their time 60/40 between their own research and sellers, from 70/30 before. (6sense)
- 281 days pass on average between a buyer's first LinkedIn ad impression and revenue, against 90 days from a first organic company page impression. (Dreamdata)
- 88 touchpoints make up the average B2B customer journey, up from 76, spread across 4 channels and 10 stakeholders. (Dreamdata)
- 13 internal stakeholders and 9 external influencers take part in a typical business buying decision, and procurement decides in 53% of buying cycles. (Forrester)
- 48% of account executives reached their annual quota in 2026, down from 51% in 2024, across 158 B2B companies. (The Bridge Group)
How to Use These Benchmarks
Benchmarks help most when you compare like with like and then act on the one step with the biggest gap.
- Pick the benchmark that counts the same conversion as you, such as sessions to qualified leads or ad clicks to leads.
- Calculate your own rate for each funnel step over the last two quarters, split by channel and by landing page.
- Compare each step with its benchmark and mark the one where you fall furthest below the median.
- Fix that step first, since a higher demo booking rate or trial conversion rate lifts every number below it.
- Check the result after one full sales cycle, because B2B deals take months to close and early numbers swing.
When the biggest gap sits at the top of the funnel, start with B2B lead generation and our B2B customer acquisition strategy guide. If you'd like help finding the weakest step with real data from your site, our B2B SEO agency team can review your funnel with you.
How We Chose These Benchmarks
We used studies published since 2024 that state their sample and date, and we opened each source to confirm every number. Older data appears only where no newer study exists, and its year is in the stat.
Each publisher supplies six stats at most, so no single company's customer base sets the picture. Many studies come from software vendors that measure their own customers, which tends to favor teams that already invest in conversion.
FAQ
What is a good conversion rate for a B2B website?
A B2B website that converts more than 5% of its sessions into qualified leads beats the 2026 average of 5.13% across 13 industries (Ruler Analytics). Software websites average 7.6% and professional services 6.1%, while SaaS landing pages convert at a 3.8% median (Unbounce).
What is a good demo request conversion rate?
The median B2B SaaS company books 62% of qualified demo requests, and the top 10% book 78% or more (RevenueHero). Between 65% and 80% of booked demos then take place (Chili Piper).
What is a good free trial conversion rate for B2B SaaS?
A free-to-paid rate of 6% to 10% is good for B2B products, and 15% to 20% is great (ChartMogul). Trials that require a credit card convert 30% of users to paid, against an 8% median across all free-to-paid models.
What is the average B2B win rate?
Median B2B SaaS win rates run from 31% on deals under $10K in annual contract value to 15% on deals above $100K (Optifai). Deals between $10K and $50K close at a 24% median.
How long is the average B2B sales cycle?
The average B2B buying cycle lasted about 10 months in 2025, down from about 11 months in 2024 (6sense). Dreamdata measures 281 days on average from a buyer's first LinkedIn ad impression to revenue.
To keep learning, read our lead to MQL conversion rate benchmarks, our conversion rate by channel data and our guide to B2B website metrics.