B2B website metrics show whether your site brings in the right buyers and turns them into pipeline. Track about 14 of them in four groups, from organic sessions and AI referrals to SQLs and revenue, and review them once a month.
We run SEO and GEO programs for B2B and SaaS teams, and this is the dashboard we set up first. For each metric you get what it shows, where to find it in GA4 or your CRM, and a benchmark when a real study has one.
Why website metrics matter for B2B
Website metrics matter in B2B because buyers research for months before they talk to sales, so your site does much of the selling before anyone books a call. Recent research shows how long that stretch has become:
- In Dreamdata's 2026 benchmarks, the B2B customer journey lasts 272 days, up from 211 days.
- Buyers spend the first 220 of those days reading content and teaching themselves before they enter the sales pipeline.
- The same journey includes 88 touchpoints spread across four channels.
- Forrester found that a typical buying decision involves 13 internal stakeholders and nine external influencers.
Long cycles mean this month's visits often show up as pipeline months later. Track early metrics such as engaged sessions next to late ones such as SQLs, so you can judge a channel before its deals close.
We sort the metrics into four groups that follow the buyer from the first visit to revenue, and each group answers one question about your site:
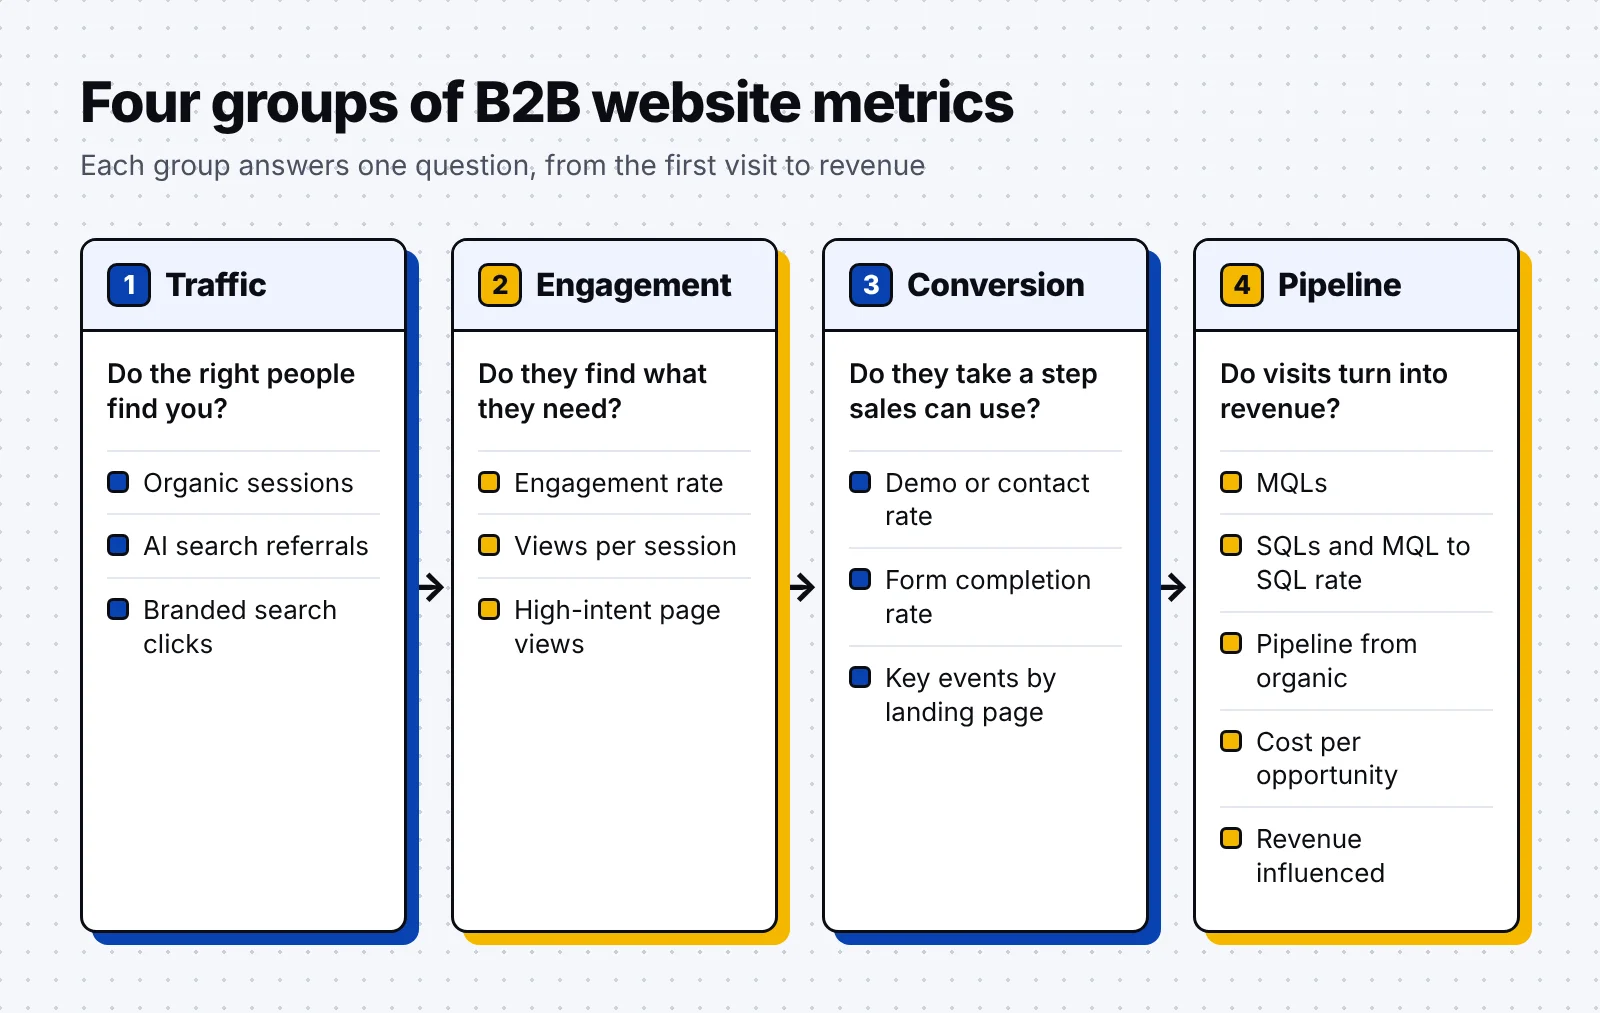
Traffic metrics
Traffic metrics tell you whether the right people find your site. Watch where each visit comes from more than the total, since one strong channel can hide a weak one. Our guide on how to increase traffic to a B2B website covers ways to grow these numbers.
1. Organic sessions
Organic sessions count visits that start from unpaid results on Google, Bing and other search engines. They show how well your content and SEO reach buyers who search for your topics.
Find them in GA4 under Reports, Acquisition, Traffic acquisition, with Session default channel group set to Organic Search. Clicks from Google's AI Overviews and AI Mode also land in this channel.
2. AI search referrals
AI search referrals are visits from links inside AI assistants such as ChatGPT, Perplexity, Gemini and Copilot. They show whether AI answers cite your brand when buyers ask about your category.
GA4 groups these visits in the AI Assistant channel of the same Traffic acquisition report. Google's examples for the channel are ChatGPT, Gemini, Deepseek, Copilot and Grok, so check Session source for perplexity.ai and claude.ai as well. These benchmarks help you size the channel:
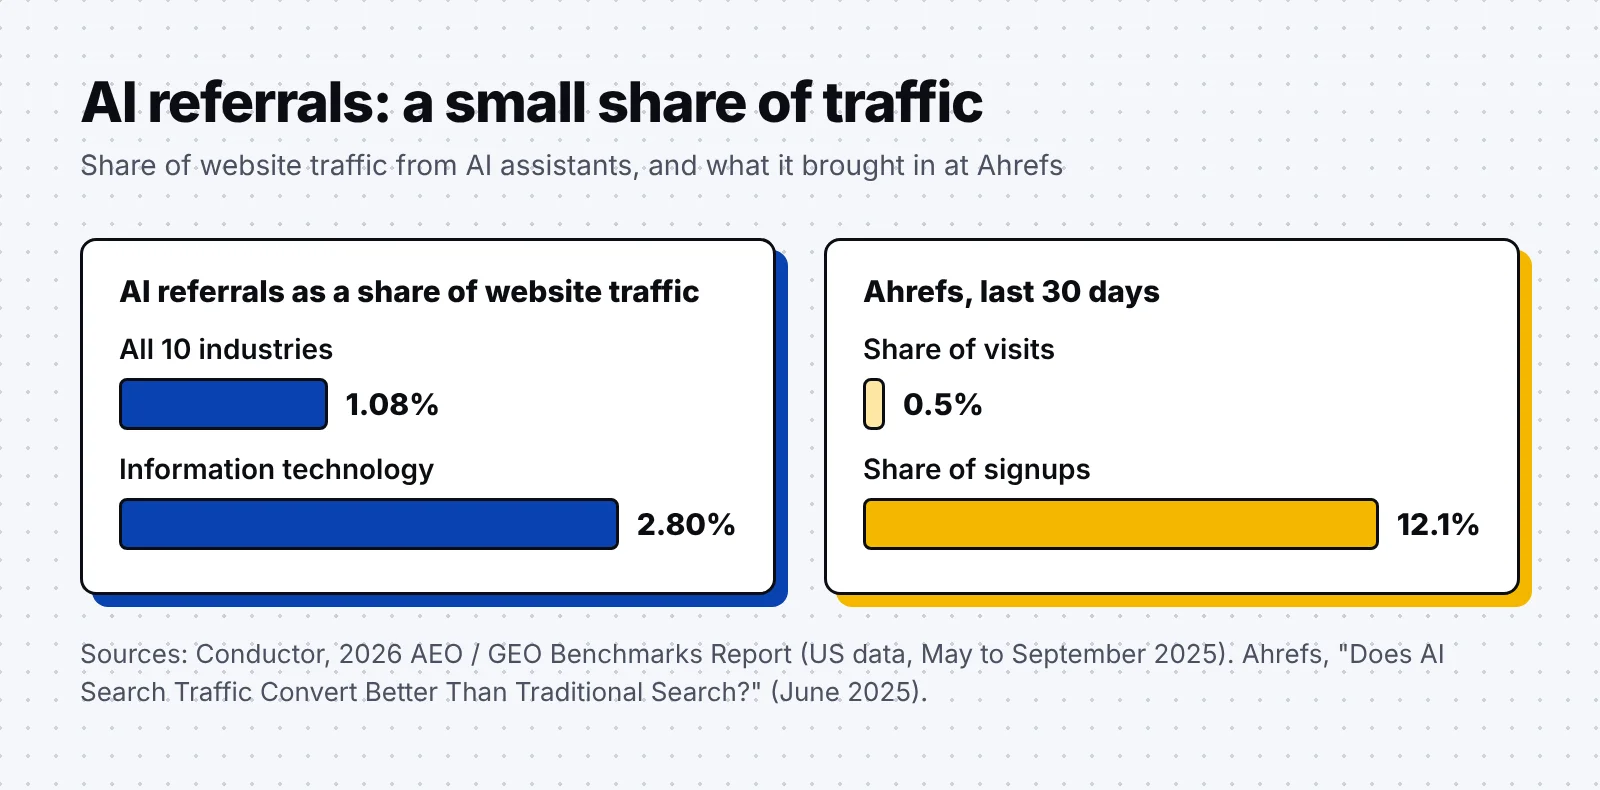
- Conductor's 2026 benchmarks put AI referrals at 1.08% of website traffic across 10 industries, and at 2.80% in information technology.
- ChatGPT sent 87.4% of the AI referral visits in Conductor's data, which covered May to September 2025.
- At Ahrefs, AI search brought 0.5% of visits over 30 days but produced 12.1% of signups.
3. Branded search clicks
Branded search clicks come from searches that include your company or product name. They show how many buyers already know you and look you up by name, often after a podcast, an AI answer or a colleague's tip.
Find them in Google Search Console under Performance, Search results, where the branded queries filter splits clicks into branded and non-branded views. Google's AI-assisted system sorts the queries, and the filter works only for top-level properties with enough search volume.
Thankfully, the same filter gives you non-branded clicks in one step. Growth there means new buyers find you through your content before they know your name.
Engagement metrics
Engagement metrics show whether visitors find what they came for once they land. Read them by channel and landing page, since a sitewide average mixes blog readers with buyers on your pricing page.
4. Engaged sessions and engagement rate
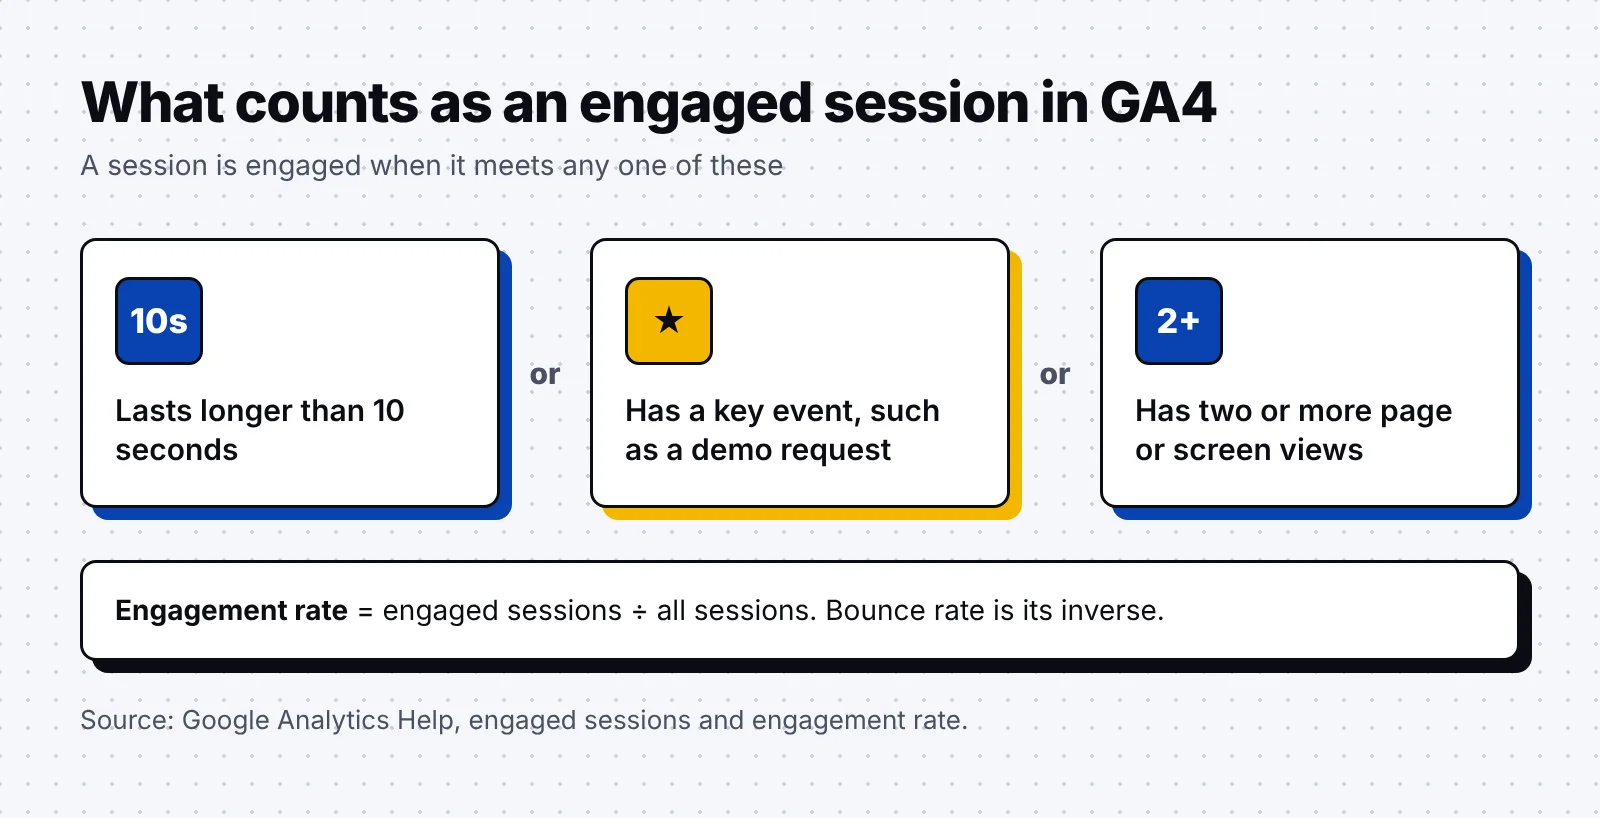
An engaged session lasts longer than 10 seconds, has a key event or has two or more page views. Engagement rate is the share of sessions that count as engaged, and bounce rate is its inverse.
Both metrics sit in the Traffic acquisition report, so you can compare channels side by side. When one landing page falls well below the others, check that it matches the search or ad that sent the visit.
5. Views per session
Views per session is GA4's name for pages per session, the average number of pages a visitor opens in one visit. It shows whether your internal links and next steps lead buyers deeper into the site.
Add it to the Traffic acquisition report through Customize report, or pull it straight into Looker Studio. Helpfully, Ahrefs found that visitors from AI search viewed 50% more pages than visitors from traditional search, so compare the two channels here.
6. High-intent page views
High-intent page views count visits to the pages buyers open close to a decision. Find them in GA4 under Reports, Engagement, Pages and screens, filtered by page path. These are the pages we count on most B2B sites:
- Pricing pages show buyers checking whether you fit their budget.
- Case studies show buyers looking for proof from companies like theirs.
- Integration pages show buyers checking that you work with the tools they already use.
- Comparison pages show buyers weighing you against other vendors on their list.
Give these pages a shared path such as /customers/ or /compare/ where you can. One filter then gives you a monthly number that stays easy to read.
Conversion metrics
Conversion metrics show how many visitors take a step that sales can act on. Count only actions with buying intent as key events, so a newsletter signup never sits in the same column as a demo request.
7. Demo or contact conversion rate
This rate is the share of sessions that end with a demo request or contact form, and GA4 calls it session key event rate. It shows how well your site turns interest into sales conversations.
Pick your demo event in the key events column of the Traffic acquisition or Landing page report to see the rate by channel and page. Unbounce puts the median SaaS landing page conversion rate at 3.8%, against 6.6% across all industries.
8. Form completion rate
Form completion rate is the share of people who start your form and then submit it. It shows whether the form itself loses buyers who had already decided to reach out.
GA4's enhanced measurement sends a form_start and a form_submit event, so divide submits by starts for each form. Submit a test entry and check both events in the Realtime report before you trust the number.
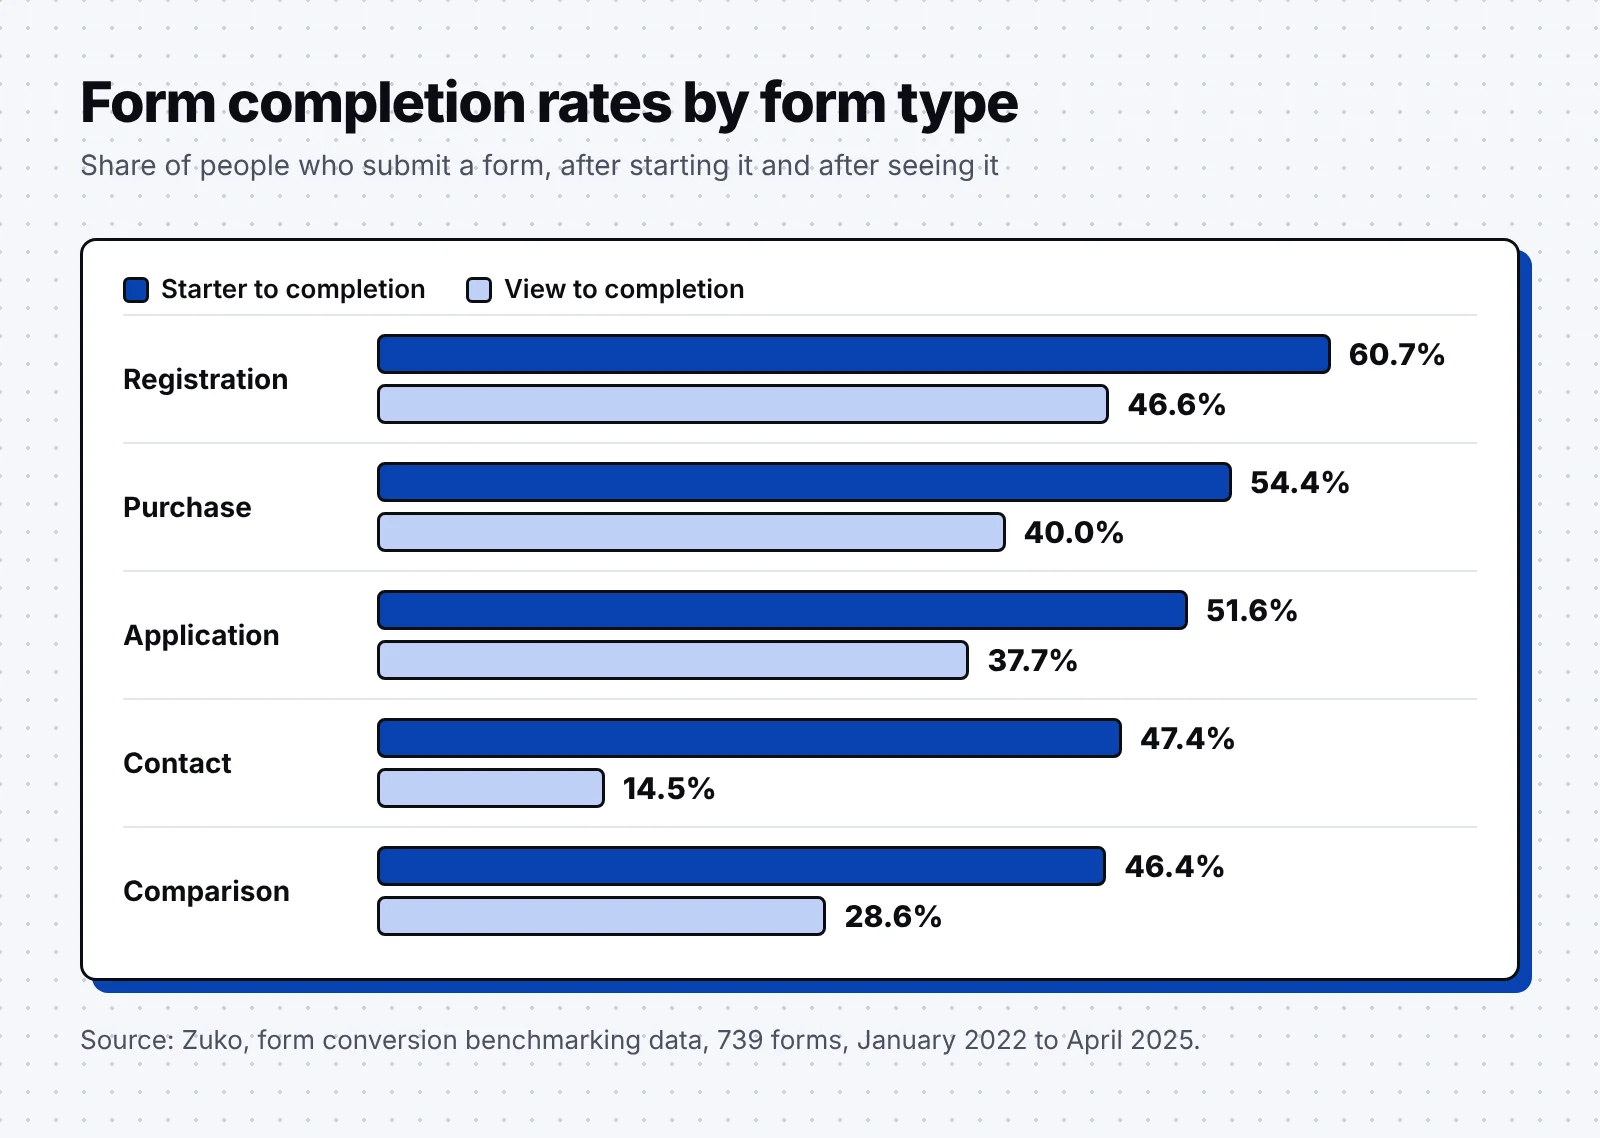
Zuko's benchmarks cover 739 forms from January 2022 to April 2025. Across all forms, 51.7% of people who start a form submit it, and contact forms convert 47.4% of starters:
9. Key events by landing page
This view counts demo and contact requests for each page where a visit started. It shows which pages bring buyers who act, so you know where new content and internal links will pay off.
Open Reports, Engagement, Landing page, and set the key events column to your demo event. Our list of the best B2B website examples shows how strong sites place a clear next step on every page.
Pipeline metrics
Pipeline metrics connect website visits to sales, and they live in your CRM. They depend on the source fields from step 3 below, so every lead keeps the channel that first brought it in.
10. MQLs
A marketing qualified lead (MQL) is a lead that fits your target market or a buyer persona. Count MQLs by original source each month to see which channels bring buyers who match your ideal customer profile.
In HubSpot, report on contacts in the MQL lifecycle stage, broken down by Original Traffic Source. Compare the share of leads that become MQLs in each channel, since a channel can bring many leads that never fit your profile.
11. SQLs and the MQL to SQL rate
A sales qualified lead (SQL) has shown that the product fits its needs and budget, and is talking with a salesperson. The MQL to SQL rate shows whether marketing and sales agree on what a good lead looks like.
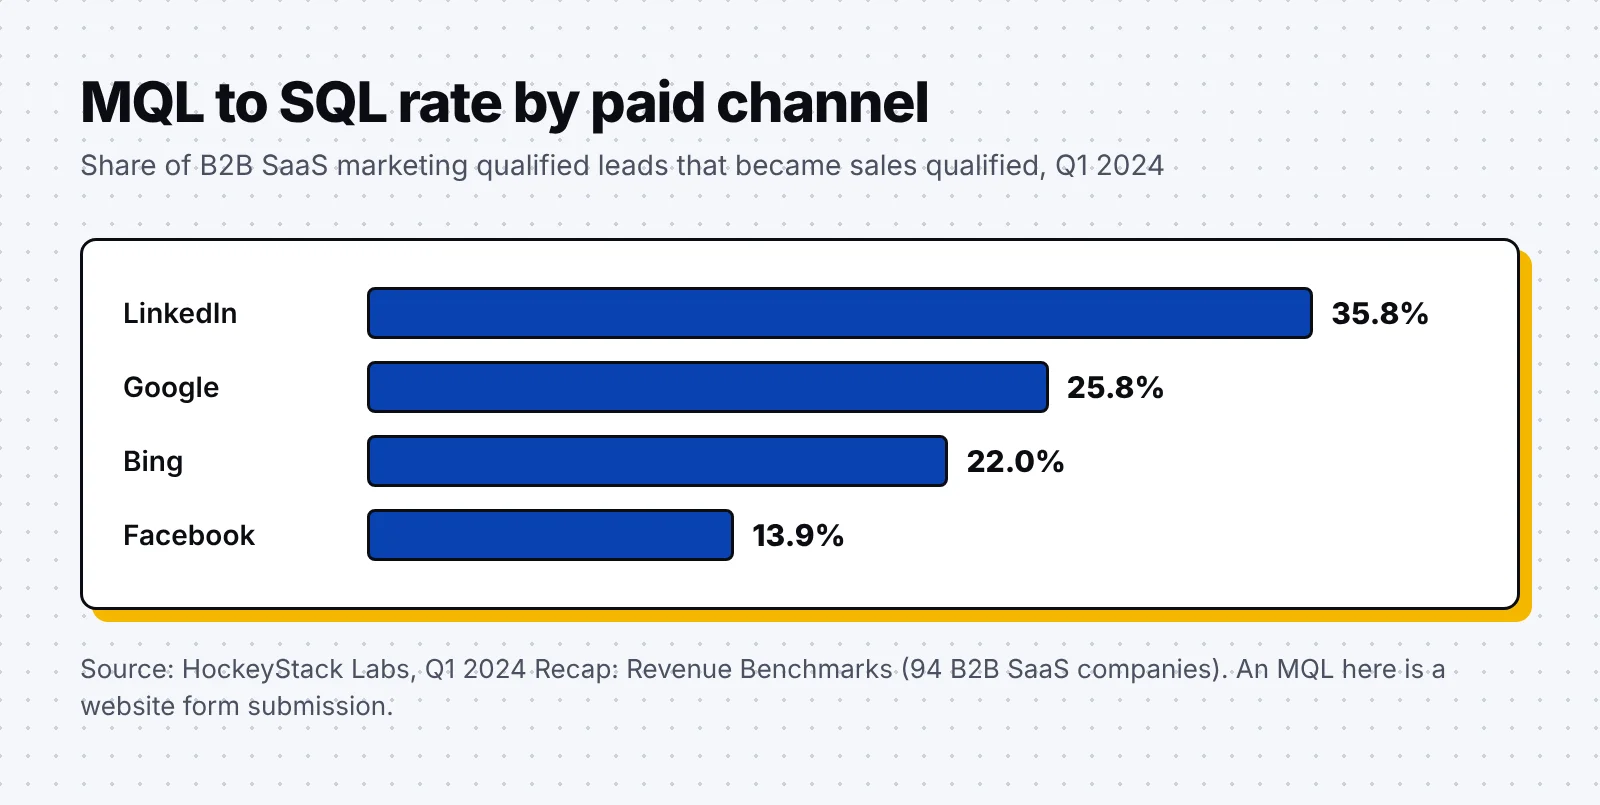
Our B2B lead generation guide shows how to write both rules down with sales. Across 94 B2B SaaS companies in Q1 2024, MQL to SQL rates for paid channels ranged from 13.9% on Facebook to 35.8% on LinkedIn:
12. Pipeline from organic
Pipeline from organic is the value of open and won opportunities whose first source was organic search or an AI referral. It ties your content and SEO work to a figure your finance team can check.
In HubSpot, filter deals by the contact's Original Traffic Source, which has separate values for Organic search and AI Referrals. In Salesforce, report on the Lead Source field of each opportunity.
13. Cost per opportunity
Cost per opportunity divides what you spent on a channel by the opportunities it created in the same period. For example, $30,000 on paid search in a quarter that created 12 opportunities is $2,500 per opportunity.
Use a three-month window, since long cycles make single months swing. For organic channels, count every cost that goes into the work:
- Add agency and freelance fees for writing, SEO and design.
- Add your share of tools such as your SEO platform and CMS.
- Add the hours your own team spends on the channel each month.
- Add any paid promotion for content, such as sponsored newsletter slots.
14. Revenue influenced
Revenue influenced is the closed-won revenue from deals where someone in the buying group touched a channel or page at any point. It credits content that helps deals along, such as a case study a buyer reads late in the cycle.
In HubSpot, use the Deal Revenue Attribution report in Marketing Hub Enterprise. In Salesforce, Customizable Campaign Influence offers first touch, last touch and even distribution models. One deal counts under several channels, so never add the channel totals together.
B2B website metrics table
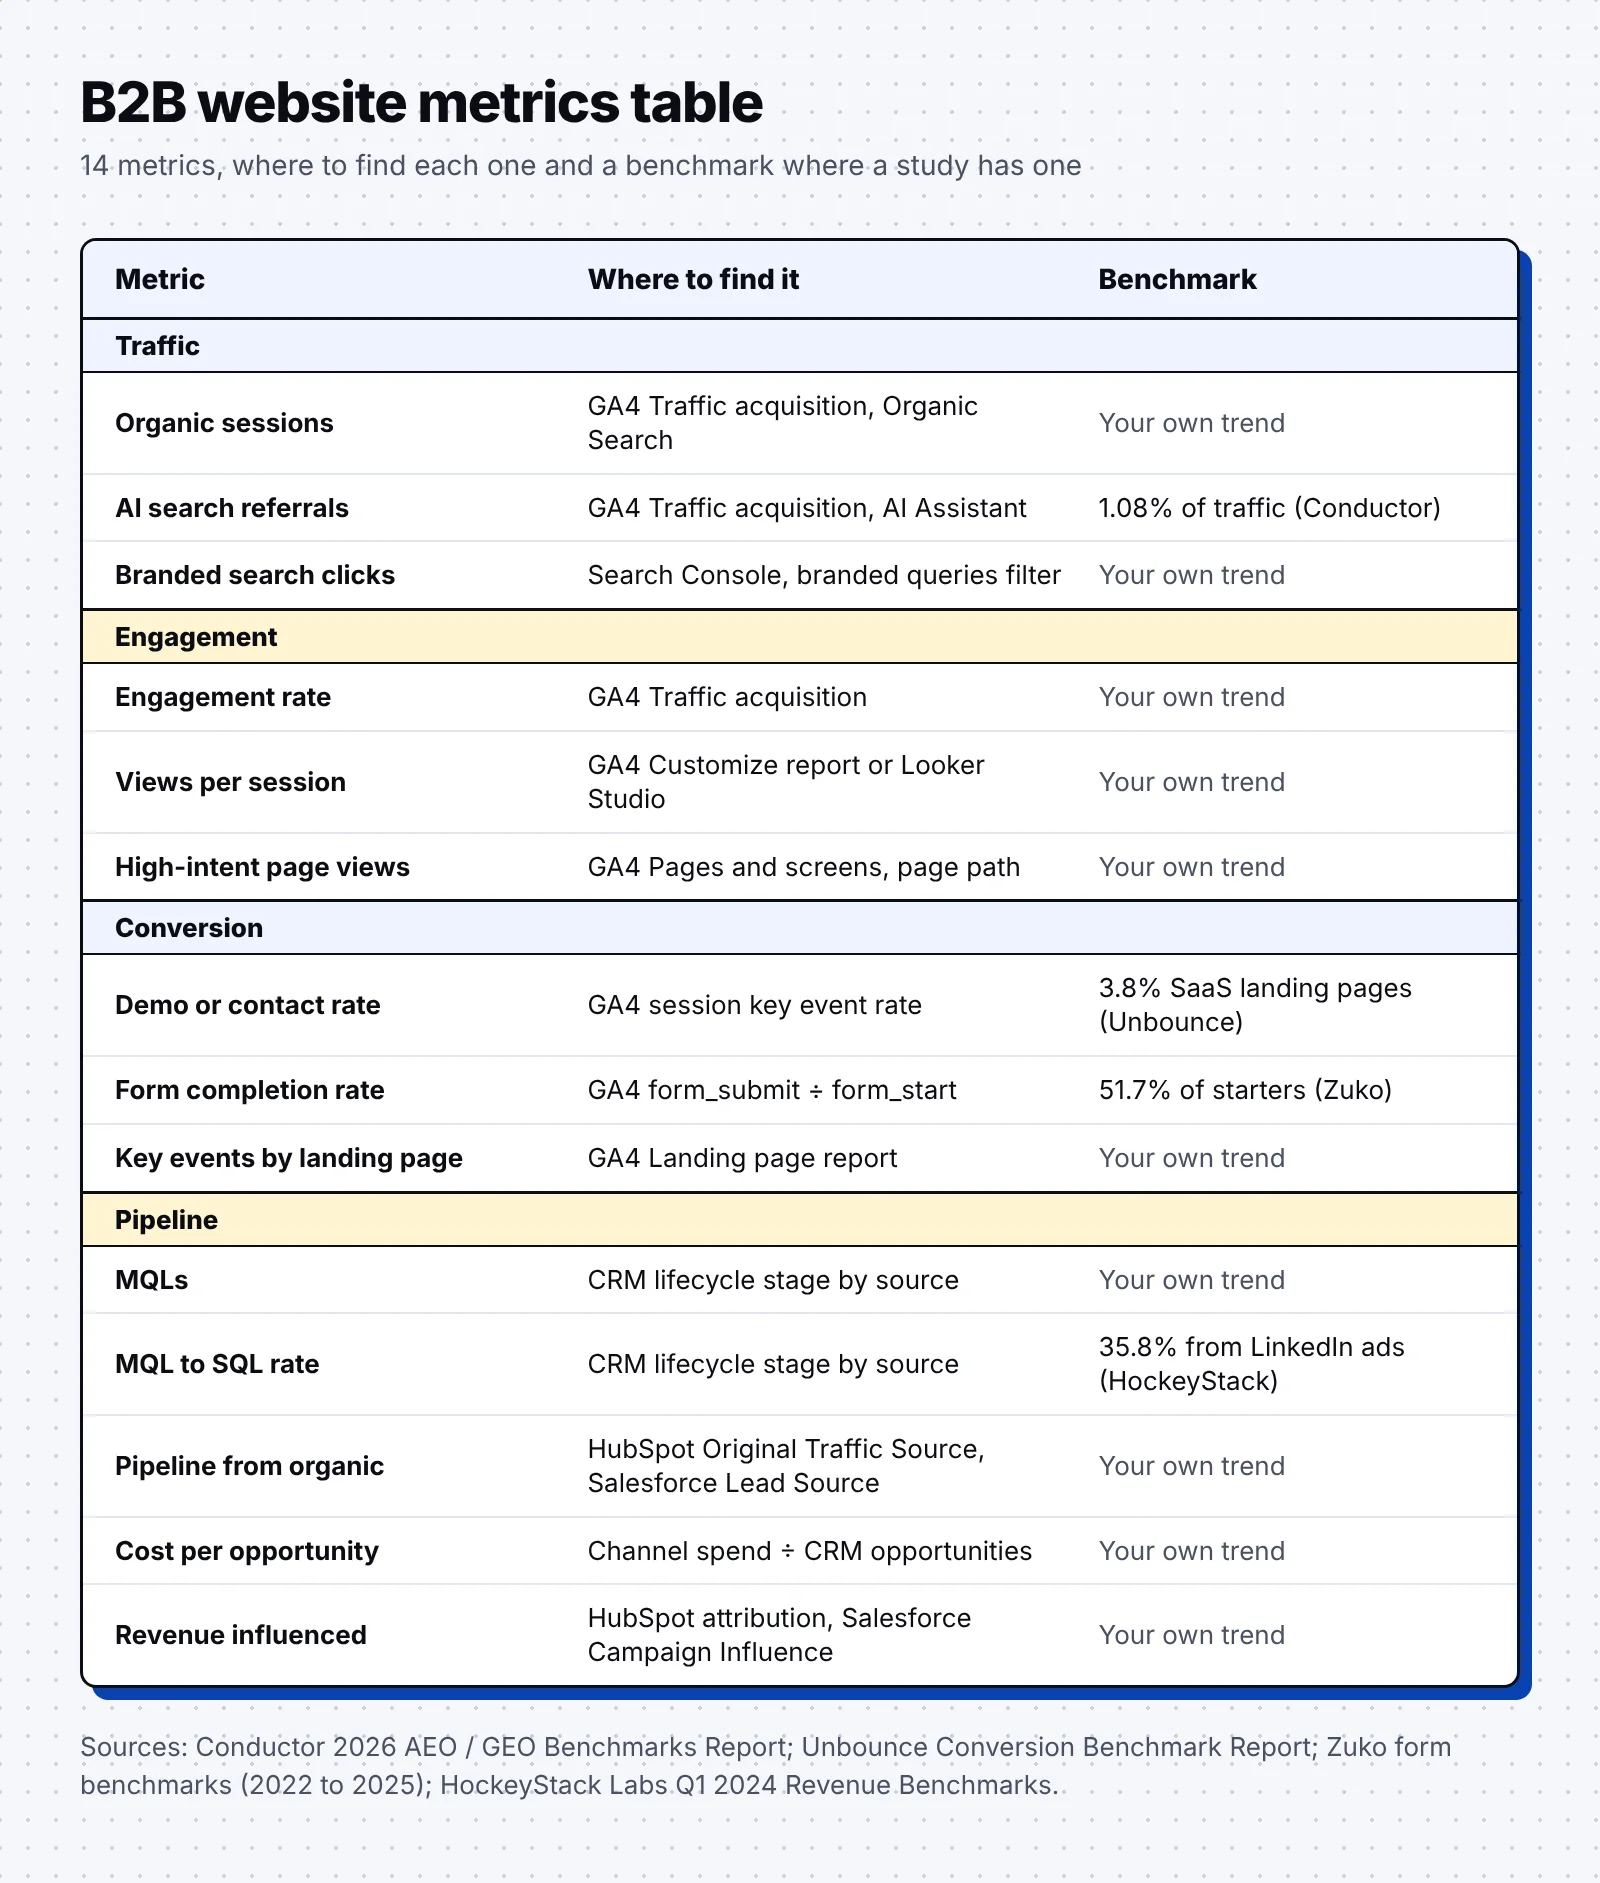
The table below puts all 14 metrics in one place, with a benchmark where a study has one. The same list follows as text, so you can copy it into your own plan:
| Metric | Group | Where to find it |
|---|---|---|
| Organic sessions | Traffic | GA4 Traffic acquisition, Organic Search |
| AI search referrals | Traffic | GA4 Traffic acquisition, AI Assistant |
| Branded search clicks | Traffic | Search Console Performance, branded filter |
| Engagement rate | Engagement | GA4 Traffic acquisition |
| Views per session | Engagement | GA4 Customize report or Looker Studio |
| High-intent page views | Engagement | GA4 Pages and screens, page path filter |
| Demo or contact conversion rate | Conversion | GA4 session key event rate |
| Form completion rate | Conversion | GA4 form_submit divided by form_start |
| Key events by landing page | Conversion | GA4 Landing page report |
| MQLs | Pipeline | CRM lifecycle stage by original source |
| SQLs and MQL to SQL rate | Pipeline | CRM lifecycle stage by original source |
| Pipeline from organic | Pipeline | HubSpot Original Traffic Source or Salesforce Lead Source |
| Cost per opportunity | Pipeline | Channel spend divided by CRM opportunities |
| Revenue influenced | Pipeline | HubSpot attribution or Salesforce Campaign Influence |
How to set up a monthly B2B website metrics dashboard in 5 steps
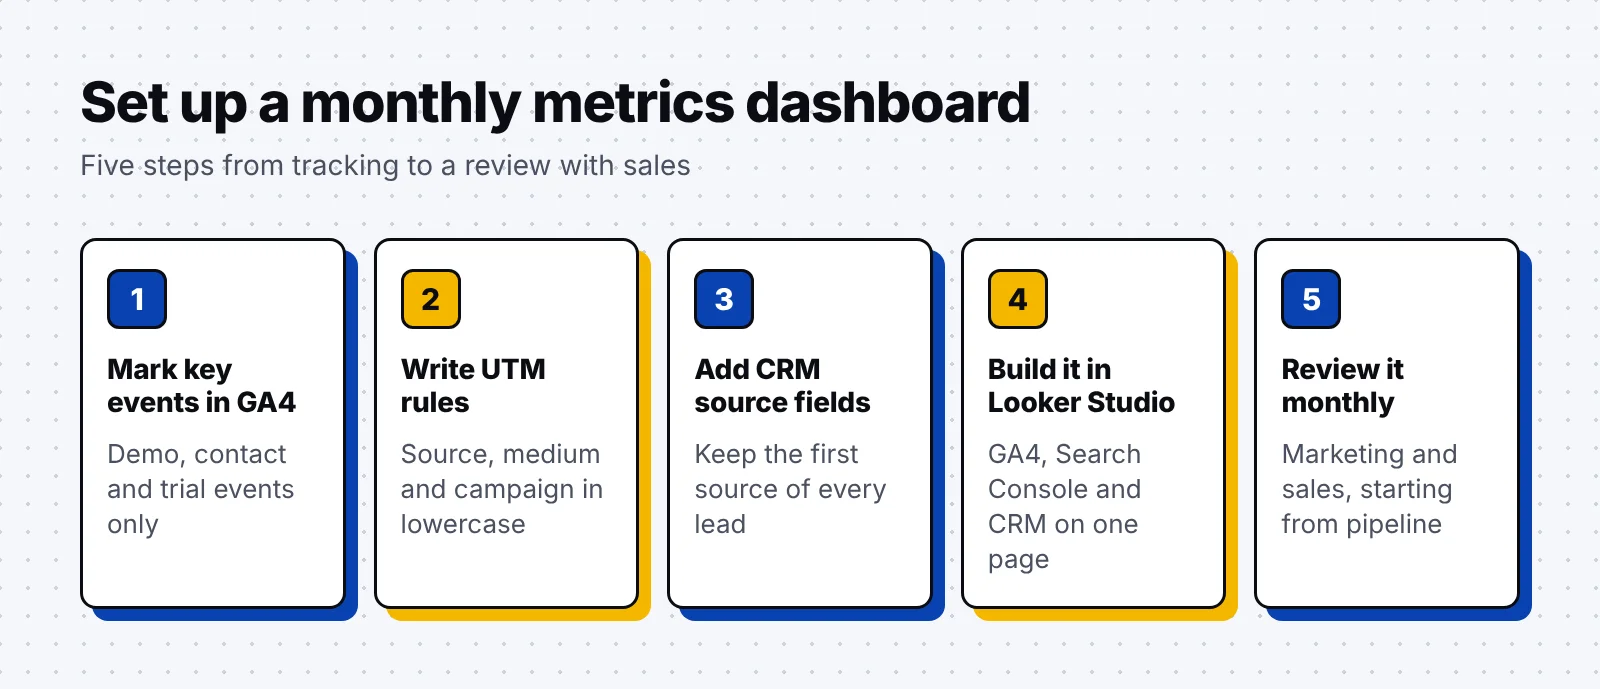
A monthly dashboard puts all four groups on one page, so marketing and sales review the same numbers. The five steps below connect GA4, your CRM and Looker Studio:
1. Mark your key events in GA4
Mark only the actions that matter to sales as key events, such as demo requests, contact forms and trial signups. In GA4, open Admin, Data display, Events, and click the star next to each event.
Standard properties allow up to 30 key events, and a newly marked event can take up to 24 hours to show in reports. Marking only changes reports from that day on, so set it up before your first monthly review.
2. Write your UTM rules
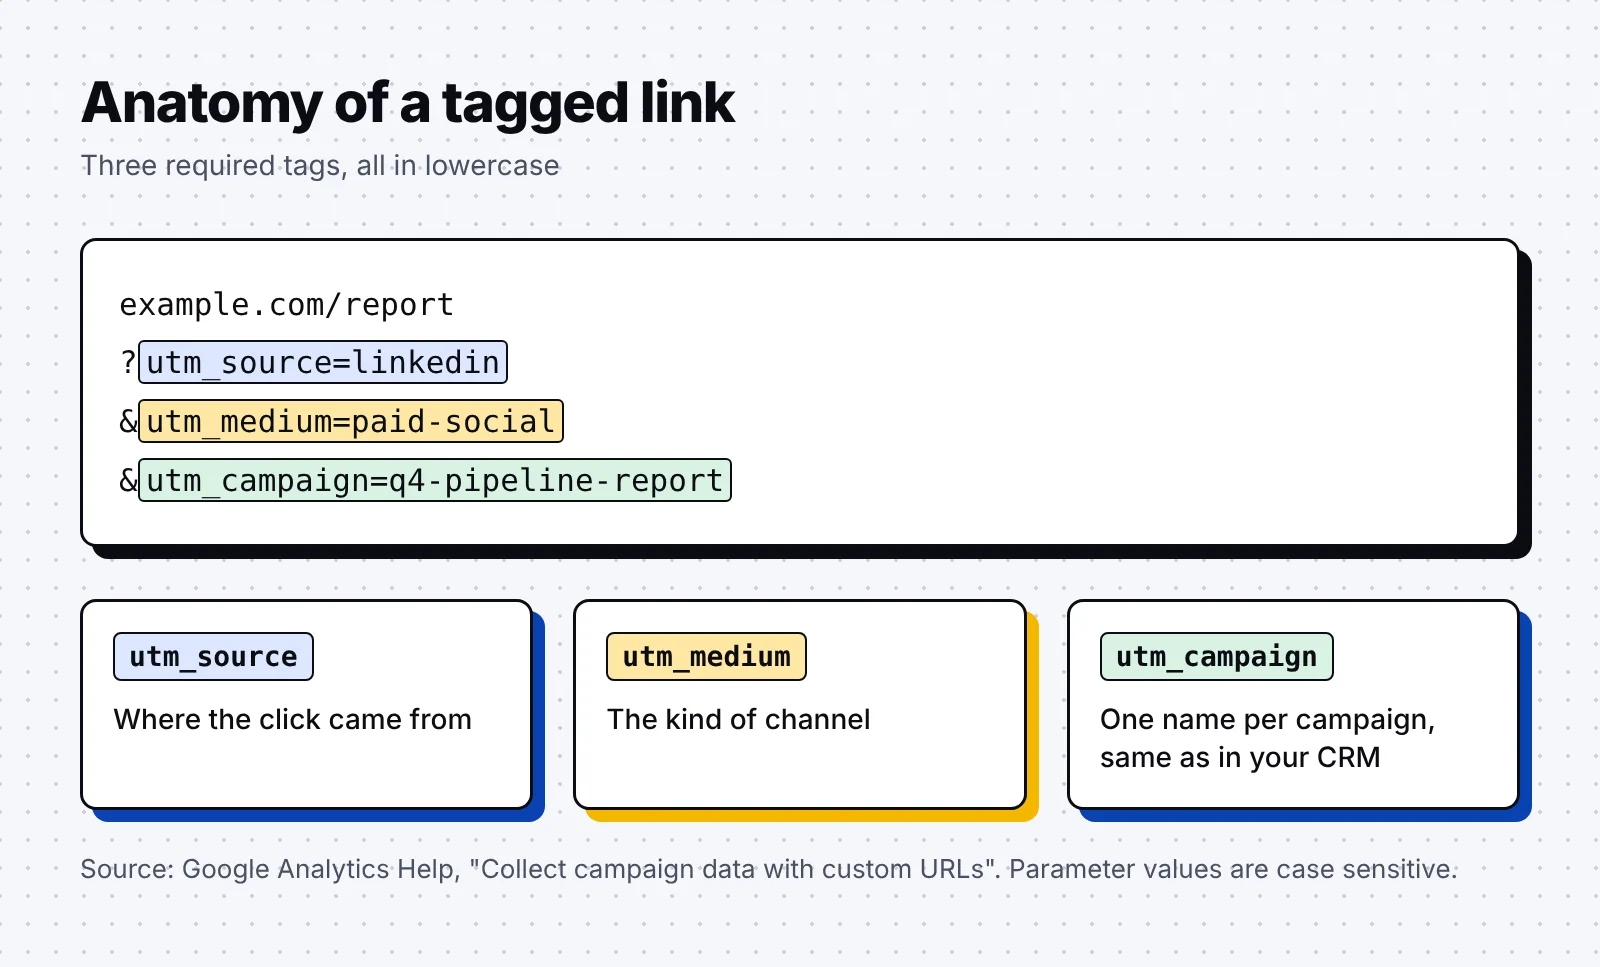
UTM tags tell GA4 where a visit came from when the link sits in an email, an ad or a social post. Write the rules down once and share them with everyone who builds links, following Google's guidance:
- Always set utm_source, utm_medium and utm_campaign, since missing values show as (not set).
- Use lowercase for every value, because GA4 reads Google and google as two different sources.
- Give each campaign one name that matches the name in your ad platform and CRM.
- Never tag links between pages of your own site, since the tag replaces the visit's real source.
3. Add source fields to your CRM
Your CRM has to keep the first source of every lead, or you can't split pipeline by channel. HubSpot fills Original Traffic Source by itself, while Salesforce needs Lead Source and UTM fields filled by your forms or marketing tool.
Add a "How did you hear about us?" field to the demo form as well. Happily, it catches the podcasts, AI chats and word of mouth that tracking tools miss.
4. Build the dashboard in Looker Studio
Looker Studio connects to GA4 through its Google Analytics connector, and you need at least Read & Analyze access to the property. Add Search Console as a second source, then bring CRM numbers in through a Google Sheet or a CRM connector.
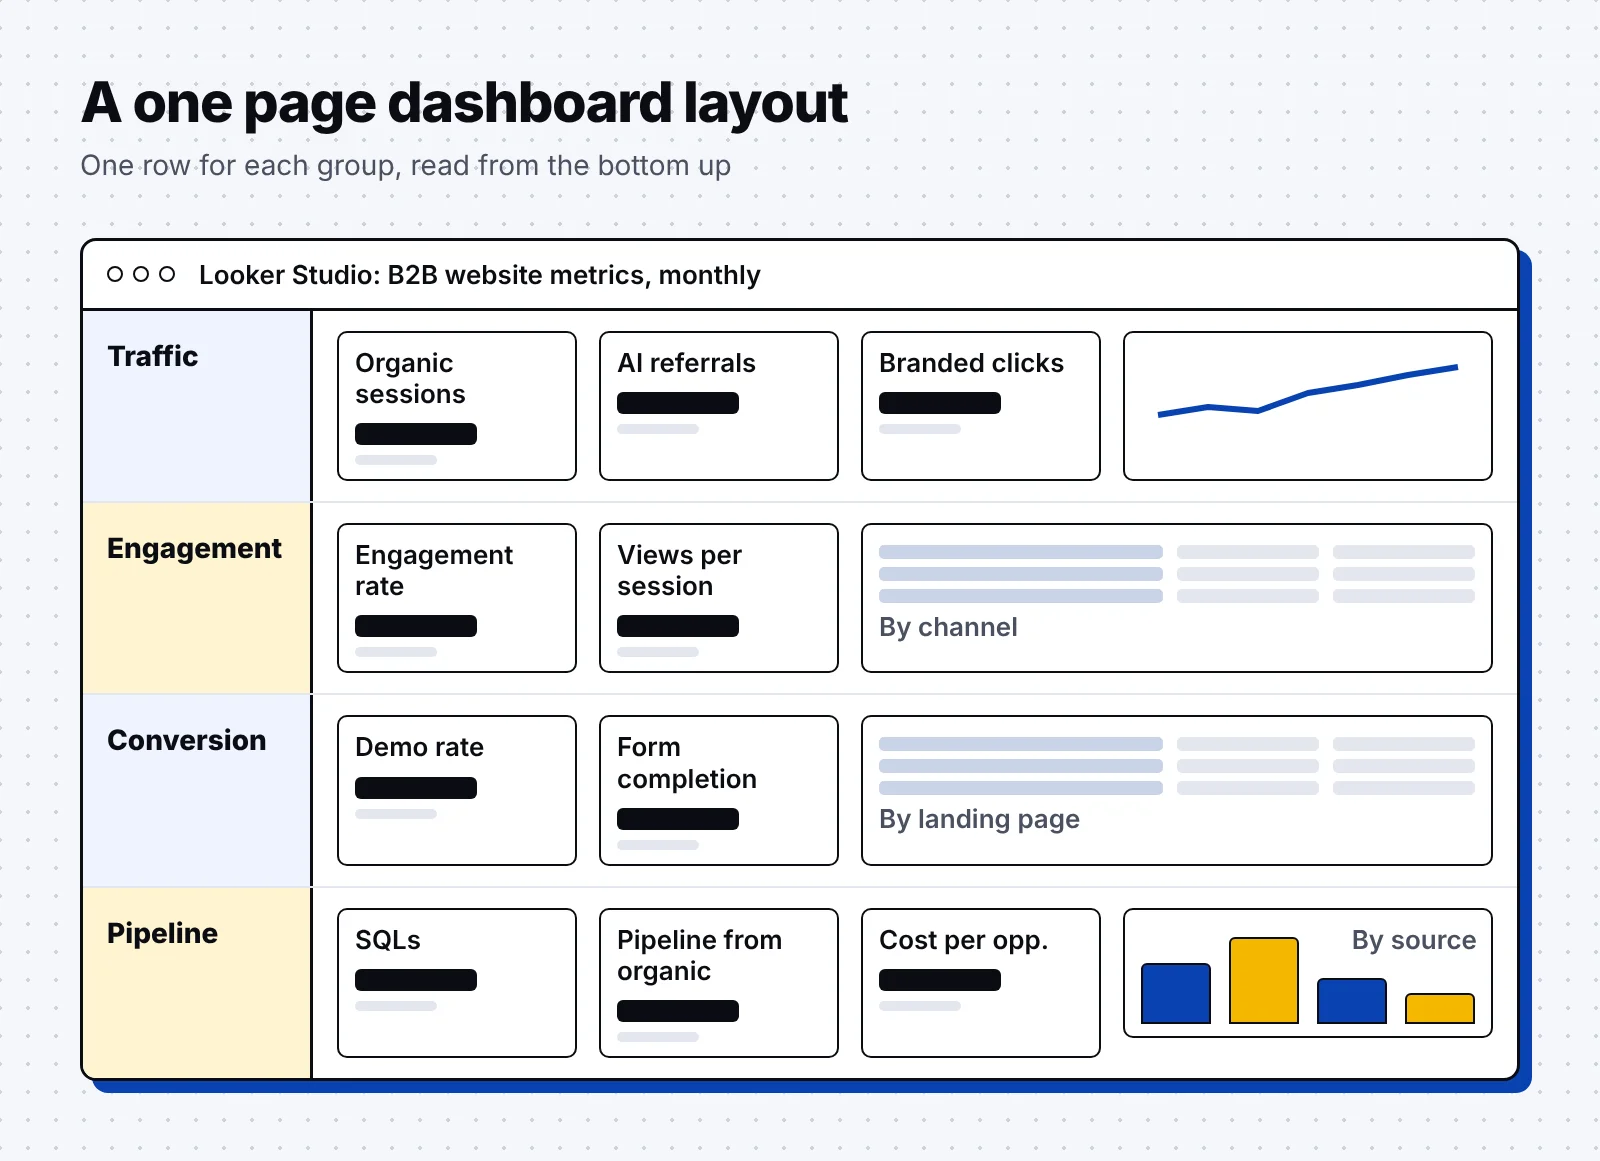
Segments and comparisons don't work through the GA4 connector, so add filters to each chart instead. Keep the dashboard to one page with a row for each group, like this layout:
Our roundup of SEO statistics gives you outside numbers for setting targets on the traffic row.
5. Review it every month with sales
Hold a 30 minute review in the first week of each month with your marketing and sales leads. Read the dashboard from the bottom up, starting with pipeline, then trace each change back to the pages and traffic behind it:
- Which channel created the most pipeline, and did its cost per opportunity change?
- Which landing pages brought in the most demo requests this month?
- Did branded clicks and AI referrals grow over the last three months?
- Which form or page lost the most buyers, and who will fix it before the next review?
B2B website metrics checklist
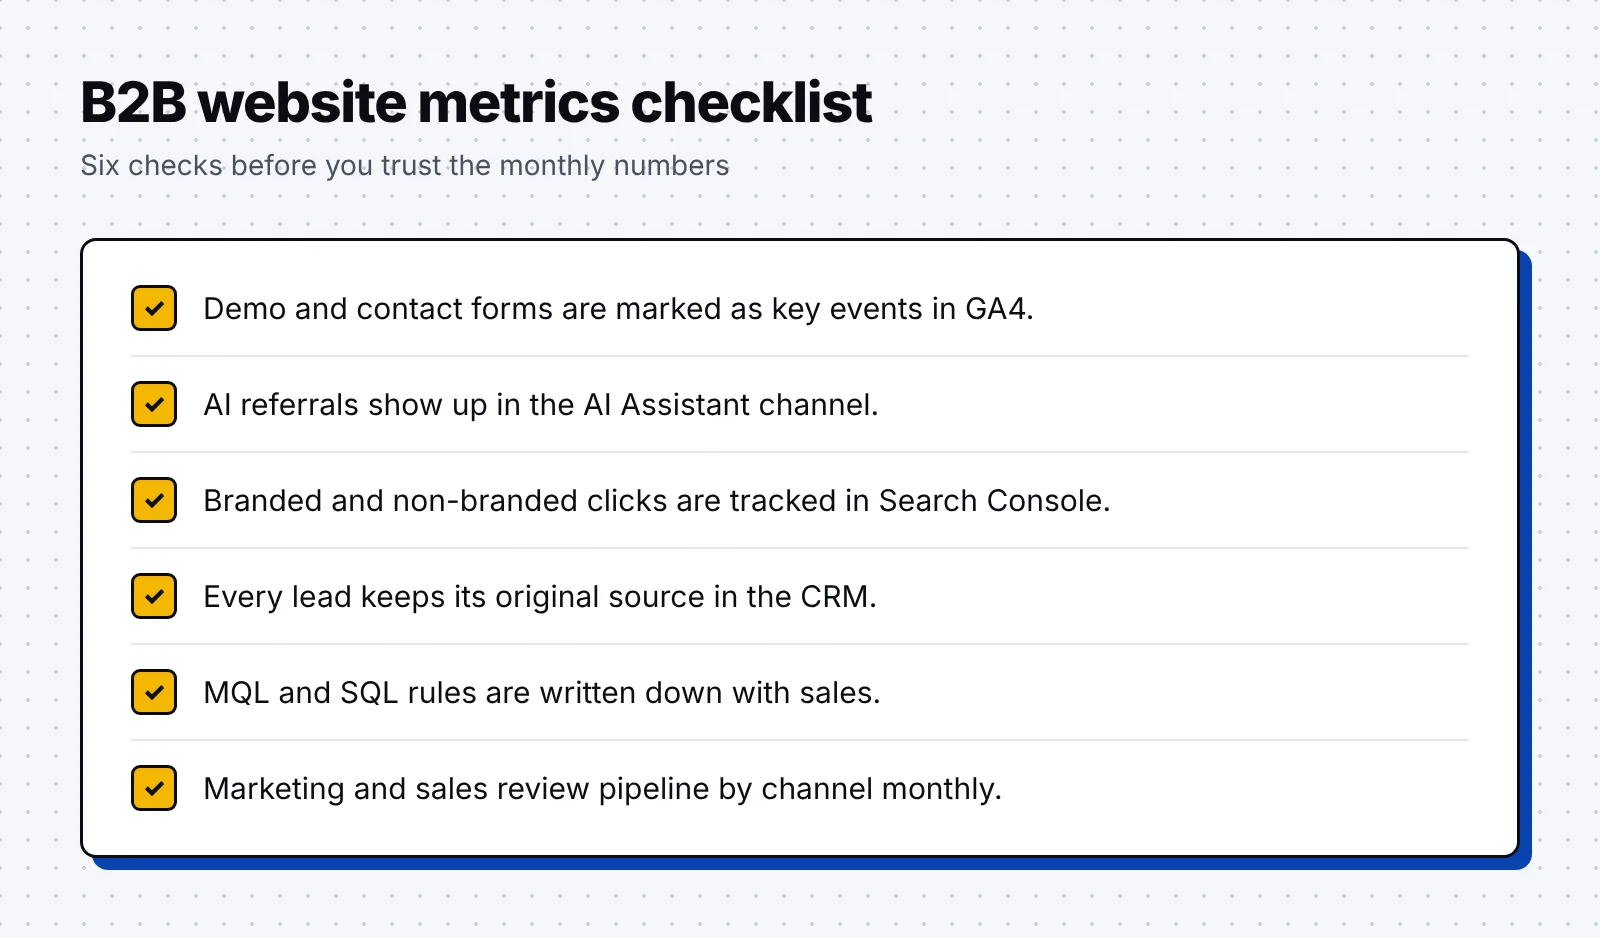
Run through this checklist when you set up the dashboard and again each quarter. The card below holds the six checks that matter most:
Tracking
- Demo, contact and trial events are marked as key events in GA4.
- The form_start and form_submit events fire on every lead form.
- Your AI referrals show up in the AI Assistant channel and in Session source.
- Search Console is set up, and you have checked the branded queries filter.
CRM
- Every lead keeps its original source, and every opportunity has a lead source.
- MQL and SQL rules are written down and agreed with sales.
- The demo form asks buyers how they heard about you.
Reporting
- Your UTM rules are written down and use lowercase values.
- The Looker Studio dashboard shows all four groups on one page.
- Marketing and sales review pipeline by channel every month.
FAQ
What are the most important B2B website metrics?
The most important B2B website metrics are the ones closest to revenue, such as SQLs, pipeline from organic and cost per opportunity. Track traffic and engagement metrics as well, since they change sooner and show where a problem starts.
How do I track AI search traffic in GA4?
Use the AI Assistant channel in the Traffic acquisition report, which groups visits from tools such as ChatGPT, Gemini and Copilot. Check Session source for perplexity.ai and claude.ai as well. Clicks from Google's AI Overviews and AI Mode count as Organic Search.
What is a good conversion rate for a B2B website?
Unbounce puts the median SaaS landing page conversion rate at 3.8%, against 6.6% across all industries. Your own trend by channel and page tells you more, so compare each month with the three before it.
What is an engaged session in GA4?
An engaged session lasts longer than 10 seconds, has a key event or has two or more page views. Engagement rate is the share of all sessions that count as engaged.
How often should you review B2B website metrics?
Review the full dashboard once a month with marketing and sales, and judge pipeline metrics over three months. Long B2B buying journeys make single months swing, so trends tell you more than any one month.
A good first step is to mark your demo and contact forms as key events in GA4 this week. Then check how much pipeline your CRM can trace to organic search and AI referrals. If AI assistants rarely send you visits, start with a free AI visibility audit to see where buyers find you now.