Win rate
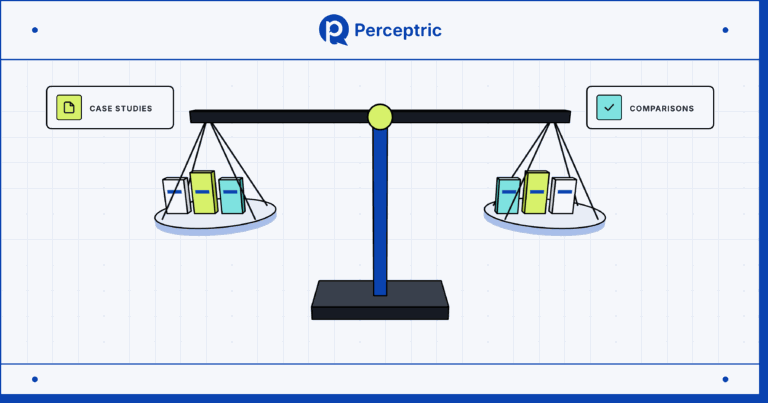
Win rate is the share of sales opportunities that end in a signed deal. If your team won 20 of the 100 opportunities that reached a decision last quarter, your win rate is 20%. Comparison pages and case studies can lift it, since buyers who read them arrive leaning your way.
What is win rate?
Win rate is the share of sales opportunities that end in a signed deal. You take the deals you won in a period and divide them by all the deals that closed in that period, won plus lost.
Let's say you sell contract management software. Last quarter, 80 opportunities reached a decision. Your team won 18 of them, lost 41 to competitors and lost 21 to buyers who decided to do nothing. Your win rate is 18 divided by 80, or 22.5%.
Win rate sits near the end of the funnel, after an SQL becomes an opportunity. It tells you how good your team is at turning real buying conversations into revenue.
Why win rate matters for B2B SaaS
Win rate multiplies everything above it. If you double your pipeline and your win rate drops by half, revenue stays flat. Lift win rate from 20% to 25% on the same pipeline, and you close a quarter more deals without one extra lead.
It's also getting harder to move. Ebsta's study of 655,000 opportunities found win rates fell 10% in 2025, even while sales cycles got 9% shorter. Buyers are moving faster and saying no more often.
Here's why I think marketers should care about this number as much as sales does:
- Buyers decide before they talk to you: According to 6sense, 94% of buying groups ranked their preferred vendors before they first talked to a seller, and 77% bought from that early favorite. Content shapes that early ranking.
- It shows which leads are real: A channel that brings lots of opportunities with a 5% win rate is worth less than one that brings fewer at 30%. Win rate by source tells you where to spend.
- It reveals competitive gaps: Win rate against each named rival shows where you lose, and that's exactly where an alternatives page or comparison page can help.
- It protects the forecast: Leaders use win rate to predict revenue from pipeline. A clean, honest number makes every forecast more useful.
How to improve win rate
Most win rate gains come from better fit and better proof. Here's my process:
- Read the lost deals first: Pull the last 20 closed-lost opportunities and the notes on why. Group the reasons into price, missing feature, lost to a rival and no decision.
- Answer the late questions in public: The questions buyers ask late in a deal, like "How long does migration take?" or "Do you have SSO?", deserve their own pages. Sales can send a link instead of writing the same email again.
- Build proof for the whole committee: A typical deal has a champion, a budget owner and someone from IT or security. Give each one a page to read, like a case study, a pricing page and a security page.
- Arm sales for named rivals: For each competitor you meet often, publish a fair comparison and give reps a short guide on when you fit better. If you keep losing to the same rival, that's the first comparison page I'd write.
- Qualify harder upstream: Opportunities that never fit your ICP drag win rate down. Tighten the rules for turning a lead into an opportunity, and the rate goes up for a real reason.
Win rate examples
Win rate depends heavily on deal size, so compare yourself with deals like yours. Here's the median B2B SaaS win rate by annual contract value, from Optifai's study of 939 companies:
| Deal size (annual contract value) | Median win rate |
|---|---|
| Under $10K | 31% |
| $10K to $50K | 24% |
| $50K to $100K | 18% |
| Over $100K | 15% |
Bigger deals involve more people, take longer and close less often. A 20% win rate is weak for a $5K self-serve upgrade and strong for a $150K enterprise deal. Our roundup of B2B conversion rates has the rest of the funnel benchmarks next to these.
How to measure win rate
Your CRM already holds everything you need. The work is in keeping the definitions steady. Here's how I'd set it up:
- The base number: In HubSpot or Salesforce, report closed-won opportunities divided by closed-won plus closed-lost for each quarter. Use the close date, so every deal counts once.
- Win rate by source: Split the same report by original source, like organic search, paid, outbound and referrals. Pass the first landing page into a hidden form field so you can see which pages started winning deals.
- Win rate by rival: Add a required "primary competitor" field on every closed deal. Then you can see your rate against each one.
- Content-touched win rate: Compare deals where a contact viewed a case study or comparison page during the deal with deals where nobody did. It shows correlation only, but a big gap is a good reason to put those pages in front of more buyers.
- Trend over time: Track a rolling four-quarter average. One quarter with a few big wins or losses can swing the number a lot.
Common win rate mistakes
- Leaving out "no decision": Deals that stall and die are losses. If you only count losses to competitors, your win rate looks great while revenue doesn't.
- Counting open deals: Dividing wins by every opportunity created, including ones still open, pulls the number down for no reason. Count only deals that closed.
- Creating opportunities late: Some reps only log an opportunity when a deal is almost done. That inflates win rate and hides where deals really fall apart.
- Comparing with the wrong benchmark: A blended industry average mixes $5K and $500K deals. Compare segment by segment.
- Treating it as a sales-only number: Marketing shapes which deals enter the pipeline and how well buyers know you before the first call. Share the win rate report with the content team.
Here's a first step for this week. Ask your sales lead for the top three reasons you lost deals last quarter. Does your website answer any of them?
Read more

FAQ
How do you calculate win rate?
Divide the opportunities you won by all the opportunities that closed in the same period, won plus lost. If 25 deals closed won and 75 closed lost, your win rate is 25%.
What is a good win rate for B2B SaaS?
It depends on deal size. In Optifai's study of 939 companies, the median ran from 31% on deals under $10K in annual contract value to 15% on deals over $100K, so compare yourself with deals of the same size.
Should "no decision" deals count as losses?
Yes, in most cases. A buyer who chose to do nothing is a deal you didn't win, and leaving those out makes your win rate look better than your pipeline really is.
Can marketing improve win rate?
Yes. Comparison pages, case studies and security pages help buyers make the case for you inside their company, and many buyers pick a favorite vendor before they ever talk to sales.